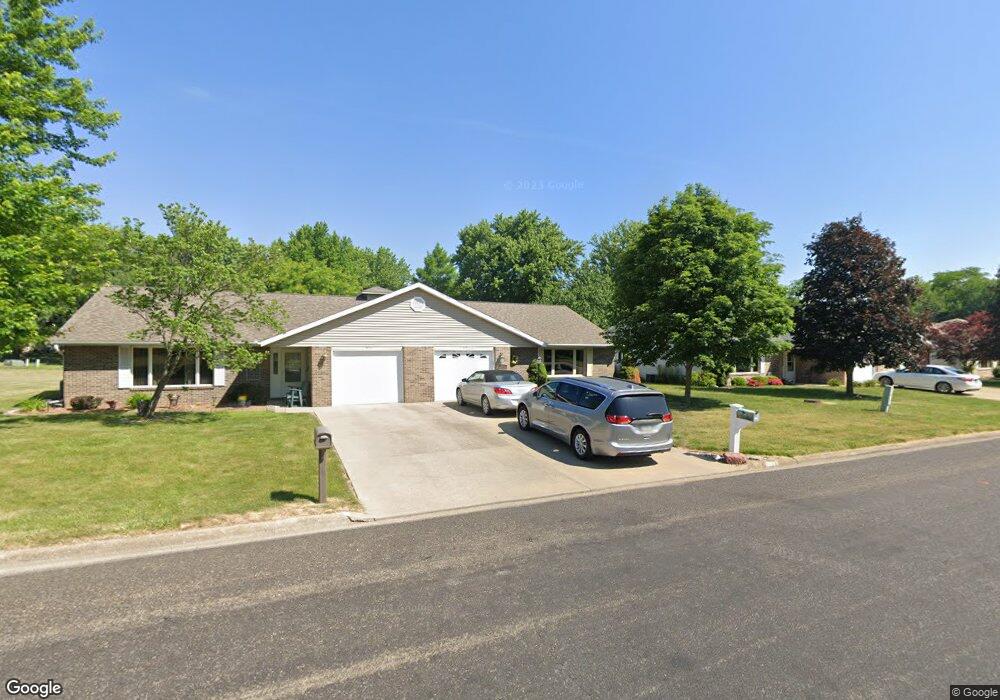
1653 E Myrtle St Canton, IL 61520
Estimated Value: $127,000 - $147,000
2
Beds
2
Baths
1,339
Sq Ft
$104/Sq Ft
Est. Value
About This Home
This home is located at 1653 E Myrtle St, Canton, IL 61520 and is currently estimated at $139,353, approximately $104 per square foot. 1653 E Myrtle St is a home located in Fulton County with nearby schools including Canton High School and Calvary Baptist Academy.
Ownership History
Date
Name
Owned For
Owner Type
Purchase Details
Closed on
Oct 20, 2009
Sold by
Moorebetty
Bought by
Defordlarry Defordlarry K and Defordlarry Kay E
Current Estimated Value
Purchase Details
Closed on
Jan 29, 2007
Sold by
Hannamgary Hannamgary L and Hannamgary Rick
Bought by
Mooreraymond Mooreraymond H and Mooreraymond Betty J
Create a Home Valuation Report for This Property
The Home Valuation Report is an in-depth analysis detailing your home's value as well as a comparison with similar homes in the area
Home Values in the Area
Average Home Value in this Area
Purchase History
| Date | Buyer | Sale Price | Title Company |
|---|---|---|---|
| Defordlarry Defordlarry K | $101,900 | -- | |
| Mooreraymond Mooreraymond H | $87,000 | -- |
Source: Public Records
Tax History
| Year | Tax Paid | Tax Assessment Tax Assessment Total Assessment is a certain percentage of the fair market value that is determined by local assessors to be the total taxable value of land and additions on the property. | Land | Improvement |
|---|---|---|---|---|
| 2024 | $2,747 | $37,720 | $3,890 | $33,830 |
| 2023 | $2,631 | $36,090 | $3,720 | $32,370 |
| 2022 | $2,484 | $36,090 | $3,720 | $32,370 |
| 2021 | $2,288 | $34,700 | $3,580 | $31,120 |
| 2020 | $2,313 | $33,220 | $3,430 | $29,790 |
| 2019 | $2,416 | $35,140 | $3,480 | $31,660 |
| 2018 | $2,337 | $34,460 | $3,410 | $31,050 |
| 2017 | $3,414 | $34,460 | $3,410 | $31,050 |
| 2016 | $2,345 | $33,950 | $3,360 | $30,590 |
| 2015 | $2,189 | $32,720 | $3,240 | $29,480 |
| 2013 | -- | $31,890 | $3,160 | $28,730 |
| 2012 | -- | $30,810 | $3,050 | $27,760 |
Source: Public Records
Map
Nearby Homes
- 1215 E Sycamore St
- 336 N 14th Ave
- 1410 E Locust St
- 1267 E Locust St
- 1227 E Locust St
- 1255 E Chestnut St
- 447 N 10th Ave
- 290 N 11th Ave
- 660 N 9th Ave
- 1951 E Walnut St
- 966 N 7th Ave
- 714 E Ash St
- 835 N 6th Ave
- 620 E Ash St
- 590 E Myrtle St
- 950 N 6th Ave
- 1600 E Walnut St
- 5 N 8th Ave
- 34 N 8th Ave
- 646 E Locust St
- 1651 E Myrtle St
- 1663 E Myrtle St
- 1643 E Myrtle St
- 1641 E Myrtle St
- 1671 E Myrtle St
- 1625 E Sycamore St
- 1673 E Myrtle St
- 1627 E Sycamore St
- 725 N 16th Ave
- 1603 E Myrtle St
- 1681 E Myrtle St
- 1605 E Sycamore St
- 1683 E Myrtle St
- 1610 E Sycamore St
- 1600 E Sycamore St
- 695 N 16th Ave
- 1691 E Myrtle St Unit 1
- 1691 E Myrtle St
- 1691 E Myrtle St
- 720 N 16th Ave
Your Personal Tour Guide
Ask me questions while you tour the home.