Estimated Value: $299,608 - $348,000
4
Beds
3
Baths
3,800
Sq Ft
$83/Sq Ft
Est. Value
About This Home
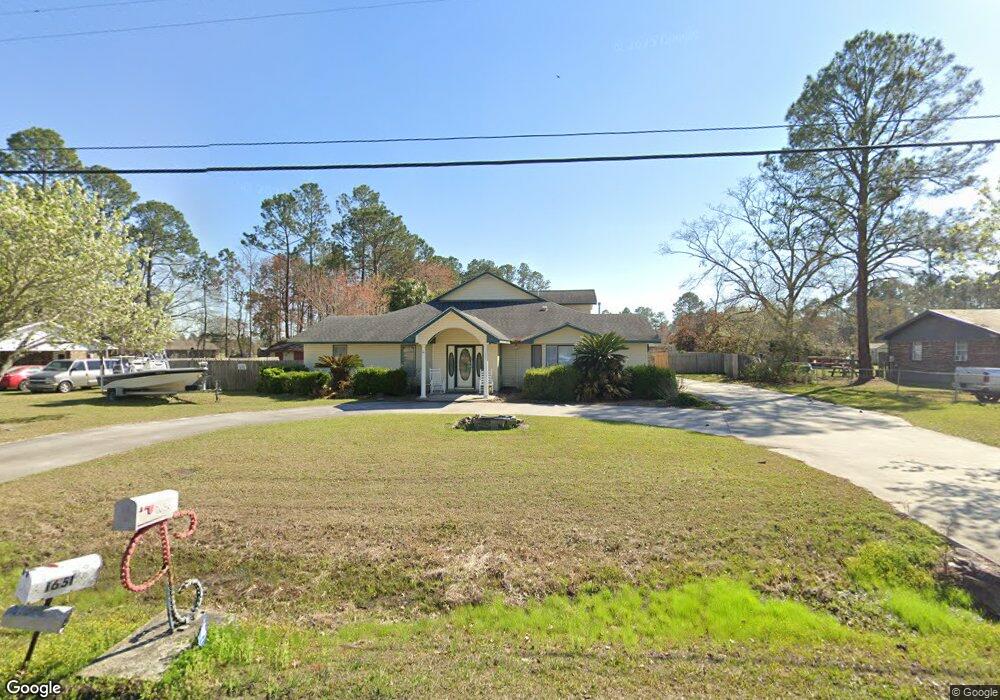
This home is located at 1656 Patterson St, Adel, GA 31620 and is currently estimated at $315,652, approximately $83 per square foot. 1656 Patterson St is a home located in Cook County with nearby schools including Cook Primary School, Cook Elementary School, and Cook County Middle School.
Ownership History
Date
Name
Owned For
Owner Type
Purchase Details
Closed on
Jul 22, 2021
Sold by
Prue Dayle E
Bought by
Peacock James D
Current Estimated Value
Home Financials for this Owner
Home Financials are based on the most recent Mortgage that was taken out on this home.
Original Mortgage
$150,000
Outstanding Balance
$136,017
Interest Rate
3%
Mortgage Type
New Conventional
Estimated Equity
$179,635
Purchase Details
Closed on
Jun 10, 2016
Sold by
Fisher Christopher P
Bought by
Prue Dayle E and Moran Lauren P
Home Financials for this Owner
Home Financials are based on the most recent Mortgage that was taken out on this home.
Original Mortgage
$161,000
Interest Rate
3.57%
Mortgage Type
New Conventional
Create a Home Valuation Report for This Property
The Home Valuation Report is an in-depth analysis detailing your home's value as well as a comparison with similar homes in the area
Home Values in the Area
Average Home Value in this Area
Purchase History
| Date | Buyer | Sale Price | Title Company |
|---|---|---|---|
| Peacock James D | $260,000 | -- | |
| Prue Dayle E | $210,000 | -- |
Source: Public Records
Mortgage History
| Date | Status | Borrower | Loan Amount |
|---|---|---|---|
| Open | Peacock James D | $150,000 | |
| Previous Owner | Prue Dayle E | $161,000 |
Source: Public Records
Tax History
| Year | Tax Paid | Tax Assessment Tax Assessment Total Assessment is a certain percentage of the fair market value that is determined by local assessors to be the total taxable value of land and additions on the property. | Land | Improvement |
|---|---|---|---|---|
| 2025 | $2,315 | $75,022 | $7,792 | $67,230 |
| 2024 | $2,696 | $81,851 | $6,160 | $75,691 |
| 2023 | $2,508 | $76,136 | $5,500 | $70,636 |
| 2022 | $2,508 | $76,136 | $5,500 | $70,636 |
| 2021 | $2,329 | $67,640 | $5,500 | $62,140 |
| 2020 | $2,329 | $67,640 | $5,500 | $62,140 |
| 2019 | $2,331 | $67,640 | $5,500 | $62,140 |
| 2018 | $2,389 | $67,640 | $5,500 | $62,140 |
| 2017 | $2,333 | $67,640 | $5,500 | $62,140 |
| 2016 | $2,336 | $67,640 | $5,500 | $62,140 |
| 2015 | $2,340 | $67,640 | $5,500 | $62,140 |
| 2014 | $2,343 | $67,640 | $5,500 | $62,140 |
| 2013 | -- | $67,640 | $5,500 | $62,140 |
Source: Public Records
Map
Nearby Homes
- 2603 Dianne St
- 2304 Thomas St
- 2696 Woodland Dr
- 284 Barrett Rd
- 1405 Pebblewood Dr
- 1702 Jimmy St
- 1402 Bear Creek Rd
- 1607 Jimmy St
- 1002 Bear Creek Rd
- 526 E Mitchell St
- 625 Coxstill Rd
- 509 E Mitchell St
- 309 Wayne St
- 315 Newton Dr
- 814 N Cleveland Ave
- 708 Town And Country Dr
- 609 E 4th St
- 106 S Goodman St
- 103 Bryan St
- 111 Brookside Dr
- 1409 Patterson St
- 1678 Patterson St
- 2702 Donna St
- 1702 Patterson St
- 1651 Patterson St
- 1677 Patterson St
- 1594 Patterson St
- 1599 Patterson St
- 2707 Thomas St
- 2709 Thomas St
- 1726 Patterson St
- 2705 Thomas St
- 1581 Patterson St
- 1711 Patterson St
- 2703 Thomas St
- 2600 Donna St
- Lot 31 Thomas St
- 2708 Thomas St
- 2710 Thomas St
- 1550 Patterson St
Your Personal Tour Guide
Ask me questions while you tour the home.