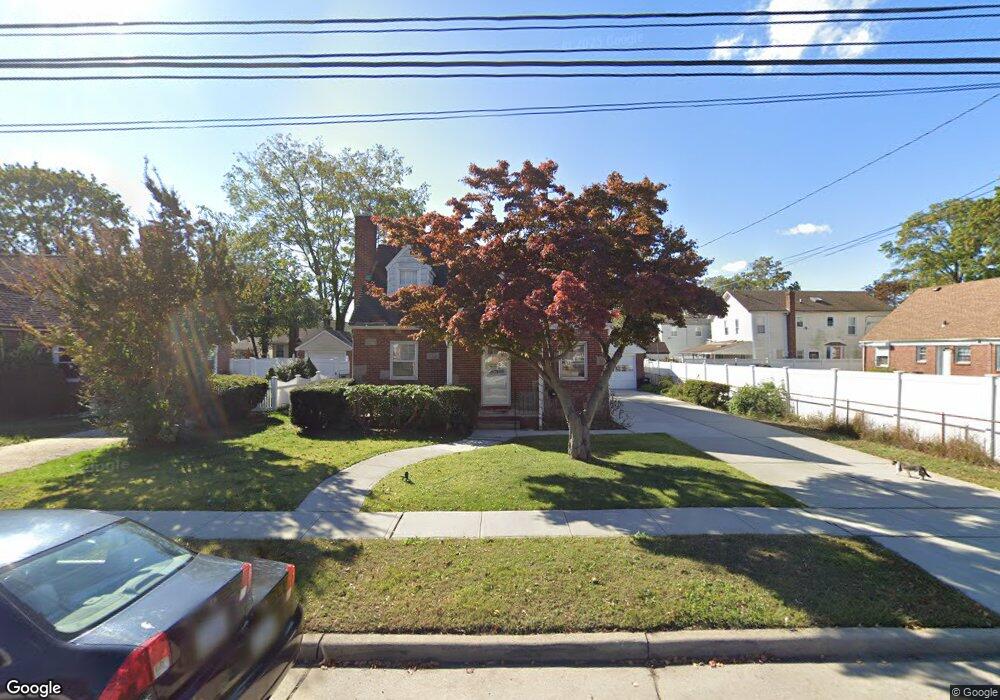
166 Botsford St Hempstead, NY 11550
Estimated Value: $601,339 - $621,000
Studio
2
Baths
1,132
Sq Ft
$540/Sq Ft
Est. Value
About This Home
This home is located at 166 Botsford St, Hempstead, NY 11550 and is currently estimated at $611,170, approximately $539 per square foot. 166 Botsford St is a home located in Nassau County with nearby schools including Grand Avenue Elementary School, Lawrence Road Middle School, and Uniondale High School.
Ownership History
Date
Name
Owned For
Owner Type
Purchase Details
Closed on
Sep 20, 2016
Sold by
Almeida Hector E and Almedia Berta
Bought by
Almeida Lucy M
Current Estimated Value
Home Financials for this Owner
Home Financials are based on the most recent Mortgage that was taken out on this home.
Original Mortgage
$164,000
Outstanding Balance
$130,997
Interest Rate
3.43%
Mortgage Type
New Conventional
Estimated Equity
$480,173
Purchase Details
Closed on
Jun 2, 1998
Sold by
Asero Rachel
Bought by
Almeida Hector and Almeida Bertha
Create a Home Valuation Report for This Property
The Home Valuation Report is an in-depth analysis detailing your home's value as well as a comparison with similar homes in the area
Home Values in the Area
Average Home Value in this Area
Purchase History
We collect this data history from publicly available records. To have your information removed, we recommend requesting removal directly through your county’s website.
| Date | Buyer | Sale Price | Title Company |
|---|---|---|---|
| Almeida Lucy M | $278,000 | American Land Services Inc | |
| Almeida Hector | $153,000 | -- |
Source: Public Records
Mortgage History
We collect this data history from publicly available records. To have your information removed, we recommend requesting removal directly through your county’s website.
| Date | Status | Borrower | Loan Amount |
|---|---|---|---|
| Open | Almeida Lucy M | $164,000 |
Source: Public Records
Tax History
| Year | Tax Paid | Tax Assessment Tax Assessment Total Assessment is a certain percentage of the fair market value that is determined by local assessors to be the total taxable value of land and additions on the property. | Land | Improvement |
|---|---|---|---|---|
| 2025 | $5,656 | $325 | $133 | $192 |
| 2024 | $831 | $330 | $135 | $195 |
| 2023 | $5,067 | $349 | $143 | $206 |
| 2022 | $5,067 | $339 | $139 | $200 |
| 2021 | $6,683 | $341 | $140 | $201 |
| 2020 | $4,845 | $405 | $352 | $53 |
| 2019 | $4,326 | $405 | $352 | $53 |
| 2018 | $4,157 | $405 | $0 | $0 |
| 2017 | $2,440 | $430 | $332 | $98 |
| 2016 | $3,192 | $456 | $317 | $139 |
| 2015 | $805 | $481 | $335 | $146 |
| 2014 | $805 | $481 | $335 | $146 |
| 2013 | $784 | $506 | $352 | $154 |
Source: Public Records
Map
Nearby Homes
- 141 Booth St
- 138 Windsor Pkwy
- 16 Hapsburg Place
- 182 Long Beach Rd
- 224 Windsor Pkwy
- 75 Botsford St
- 75 Beebe Ave
- 225 Windsor Pkwy
- 65 Botsford St
- 30 Pierson Ave
- 238 Lawson St
- 44 Nassau Pkwy
- 247 Windsor Pkwy
- 82 Bedford Rd
- 245 Lawson St
- 14 Cleaves Ave
- 7 Bernhard St
- 23 Allen St
- 8 Frazier St
- 597 Woodland Dr
Your Personal Tour Guide
Ask me questions while you tour the home.