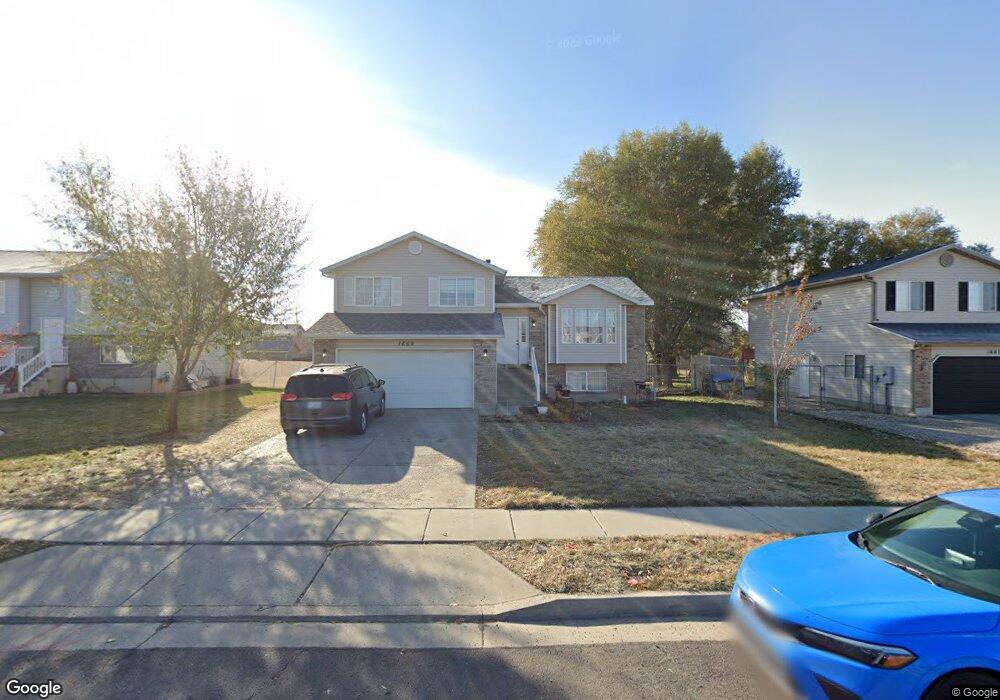
1669 W 735 N Clearfield, UT 84015
Estimated Value: $436,000 - $502,000
3
Beds
2
Baths
2,124
Sq Ft
$224/Sq Ft
Est. Value
About This Home
This home is located at 1669 W 735 N, Clearfield, UT 84015 and is currently estimated at $475,732, approximately $223 per square foot. 1669 W 735 N is a home located in Davis County with nearby schools including Lakeside School, West Point Junior High School, and Syracuse High School.
Ownership History
Date
Name
Owned For
Owner Type
Purchase Details
Closed on
Mar 30, 2005
Sold by
Higley Justin
Bought by
Mejla Tyrons
Current Estimated Value
Home Financials for this Owner
Home Financials are based on the most recent Mortgage that was taken out on this home.
Original Mortgage
$25,650
Interest Rate
5.12%
Mortgage Type
Stand Alone Second
Purchase Details
Closed on
Sep 19, 2003
Sold by
Mark Higley Construction Lc
Bought by
Higley Justin
Home Financials for this Owner
Home Financials are based on the most recent Mortgage that was taken out on this home.
Original Mortgage
$117,650
Interest Rate
6.3%
Mortgage Type
Purchase Money Mortgage
Purchase Details
Closed on
Feb 18, 2003
Sold by
M & D Developers Llc
Bought by
Mark Higley Construction Lc
Home Financials for this Owner
Home Financials are based on the most recent Mortgage that was taken out on this home.
Original Mortgage
$106,875
Interest Rate
5.89%
Create a Home Valuation Report for This Property
The Home Valuation Report is an in-depth analysis detailing your home's value as well as a comparison with similar homes in the area
Home Values in the Area
Average Home Value in this Area
Purchase History
| Date | Buyer | Sale Price | Title Company |
|---|---|---|---|
| Mejla Tyrons | -- | None Available | |
| Higley Justin | -- | Heritage West Title Ins | |
| Mark Higley Construction Lc | -- | Heritage West Title Insuranc |
Source: Public Records
Mortgage History
| Date | Status | Borrower | Loan Amount |
|---|---|---|---|
| Closed | Mejla Tyrons | $25,650 | |
| Open | Mejla Tyrons | $102,600 | |
| Previous Owner | Higley Justin | $117,650 | |
| Previous Owner | Mark Higley Construction Lc | $106,875 |
Source: Public Records
Tax History
| Year | Tax Paid | Tax Assessment Tax Assessment Total Assessment is a certain percentage of the fair market value that is determined by local assessors to be the total taxable value of land and additions on the property. | Land | Improvement |
|---|---|---|---|---|
| 2025 | $2,454 | $235,950 | $95,402 | $140,548 |
| 2024 | $2,367 | $228,800 | $104,335 | $124,465 |
| 2023 | $2,158 | $212,300 | $65,802 | $146,497 |
| 2022 | $2,429 | $437,000 | $130,996 | $306,004 |
| 2021 | $2,242 | $329,000 | $92,123 | $236,877 |
| 2020 | $1,948 | $283,000 | $79,316 | $203,684 |
| 2019 | $1,889 | $268,000 | $90,770 | $177,230 |
| 2018 | $1,765 | $246,000 | $76,421 | $169,579 |
| 2016 | $1,544 | $111,156 | $28,166 | $82,990 |
| 2015 | $1,515 | $103,676 | $28,166 | $75,510 |
| 2014 | $1,498 | $104,128 | $28,166 | $75,962 |
| 2013 | -- | $99,595 | $27,143 | $72,452 |
Source: Public Records
Map
Nearby Homes
- 690 N 1775 W
- 1654 W 600 N
- 1805 W 675 N
- 1456 W 570 N
- 1411 W 570 N
- 575 N 1350 W Unit 137
- 563 N 1350 W Unit 139
- 526 N 1350 W Unit 204
- 1681 W 350 N
- 1254 W 725 N
- 691 N 1250 W
- 1260 W 450 N
- 35 N 1275 W Unit 103
- 1180 W 700 N
- 1125 W 700 N
- 1251 W 400 N Unit 67
- 1239 W 400 N Unit 63
- 206 N 2000 W
- 417 N 1200 W Unit 84
- 1213 W 400 N Unit 51
Your Personal Tour Guide
Ask me questions while you tour the home.