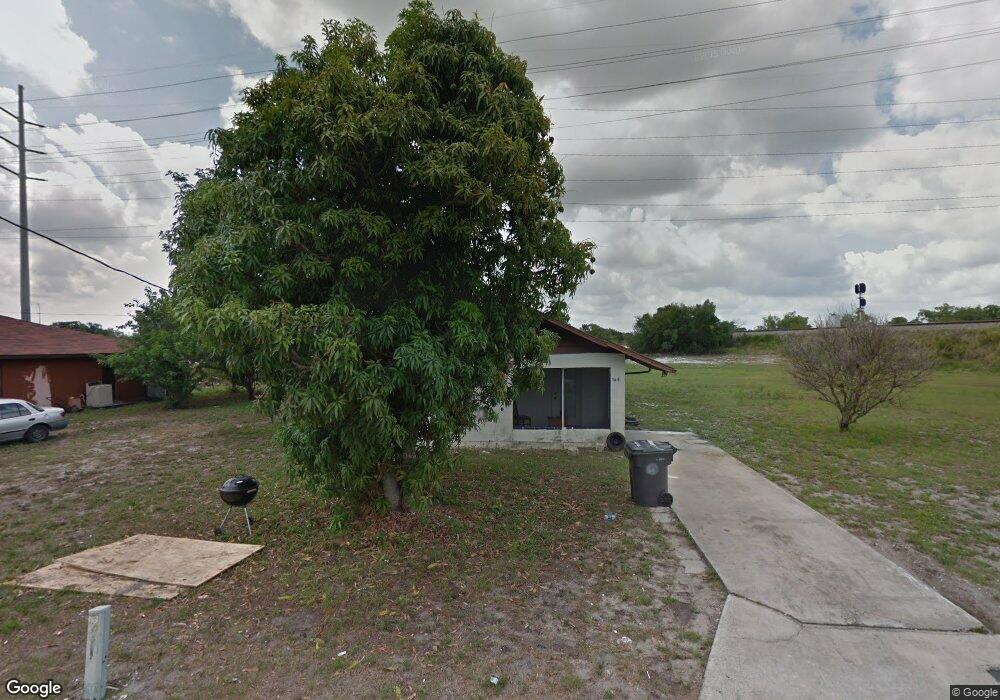
168 E Rainbow Dr Avon Park, FL 33825
Estimated Value: $97,000 - $140,000
2
Beds
1
Bath
802
Sq Ft
$146/Sq Ft
Est. Value
About This Home
This home is located at 168 E Rainbow Dr, Avon Park, FL 33825 and is currently estimated at $117,063, approximately $145 per square foot. 168 E Rainbow Dr is a home located in Highlands County with nearby schools including Avon Park High School, Sun 'N Lake Elementary School, and Avon Park Middle School.
Ownership History
Date
Name
Owned For
Owner Type
Purchase Details
Closed on
Oct 22, 2019
Sold by
Anaskia Baisden
Bought by
Thomas Anita
Current Estimated Value
Purchase Details
Closed on
Apr 19, 2018
Sold by
Baisden Anoskia
Bought by
Evans Antreon and Hawk Alonia
Purchase Details
Closed on
Apr 18, 2018
Sold by
Evans Antreon
Bought by
Hawk Barbara Ann
Purchase Details
Closed on
Jan 4, 2018
Sold by
Hawk Vandy
Bought by
Baisden Anoskia and Estate Of Leslie Hawk
Purchase Details
Closed on
Sep 14, 2015
Sold by
Hawk Vandy
Bought by
Hawk Leslie and Baisden Anookia
Purchase Details
Closed on
Jan 4, 2001
Sold by
Southside Park Company
Bought by
Hawk Vandy and Hawk Barbara A
Home Financials for this Owner
Home Financials are based on the most recent Mortgage that was taken out on this home.
Original Mortgage
$17,500
Interest Rate
7.02%
Mortgage Type
Seller Take Back
Purchase Details
Closed on
Nov 19, 1999
Sold by
Small Margaret P
Bought by
Southside Park Company
Create a Home Valuation Report for This Property
The Home Valuation Report is an in-depth analysis detailing your home's value as well as a comparison with similar homes in the area
Home Values in the Area
Average Home Value in this Area
Purchase History
| Date | Buyer | Sale Price | Title Company |
|---|---|---|---|
| Thomas Anita | $100 | -- | |
| Evans Antreon | -- | Attorney | |
| Hawk Barbara Ann | -- | Attorney | |
| Hawk Barbara Ann | -- | Attorney | |
| Baisden Anoskia | -- | Attorney | |
| Hawk Leslie | -- | Attorney | |
| Hawk Vandy | $18,000 | -- | |
| Southside Park Company | $16,700 | -- |
Source: Public Records
Mortgage History
| Date | Status | Borrower | Loan Amount |
|---|---|---|---|
| Previous Owner | Hawk Vandy | $17,500 |
Source: Public Records
Tax History
| Year | Tax Paid | Tax Assessment Tax Assessment Total Assessment is a certain percentage of the fair market value that is determined by local assessors to be the total taxable value of land and additions on the property. | Land | Improvement |
|---|---|---|---|---|
| 2025 | $734 | $71,354 | $8,717 | $62,637 |
| 2024 | $716 | $72,665 | $6,101 | $66,564 |
| 2023 | $716 | $71,266 | $6,101 | $65,165 |
| 2022 | $914 | $51,135 | $6,101 | $45,034 |
| 2021 | $836 | $49,712 | $6,101 | $43,611 |
| 2020 | $691 | $40,305 | $0 | $0 |
| 2019 | $617 | $36,307 | $0 | $0 |
| 2018 | $564 | $35,844 | $0 | $0 |
| 2017 | $487 | $26,449 | $0 | $0 |
| 2016 | $517 | $32,186 | $0 | $0 |
| 2015 | $486 | $21,144 | $0 | $0 |
| 2014 | $479 | $0 | $0 | $0 |
Source: Public Records
Map
Nearby Homes
- 165 E Rainbow St
- 1472 Williams Gray Ct
- 200 Hatcher Ave
- 0 Alice Nelson St
- 58 Alice Nelson St
- 30 E Metcalfe St
- 302 Garrett Rd
- 47 Palm Cir
- 215 Tulane Dr
- 306 Fred Conner St
- 53 Coral Dr
- 64 Coral Dr
- 50 Coral Dr
- 322 Ben Hicks St
- 43 Live Bait Dr
- 158 Corbans Way
- 247 River Walk Way
- 37 Live Bait Dr
- 241 River Walk Way
- 33 Live Bait Dr
- 173 E Rainbow St
- 174 E Rainbow St
- 174 E Rainbow St
- 173 E Rainbow St
- 172 E Rainbow St
- 172 E Rainbow St
- 161 + 165 E Rainbow St
- 1460 Williams Gray Ct
- 1452 Williams Gray Ct
- 1320 Strong Ave
- 1314 Strong Ave
- 1443 Williams Gray Ct
- 1312 Strong Ave
- 1439 Williams Gray Ct
- 202 C Love St
- 1310 Strong Ave
- 1313 Strong Ave
- 1311 Strong Ave
- 1435 Williams Gray Ct
- 203 Williams Gray Ct
Your Personal Tour Guide
Ask me questions while you tour the home.