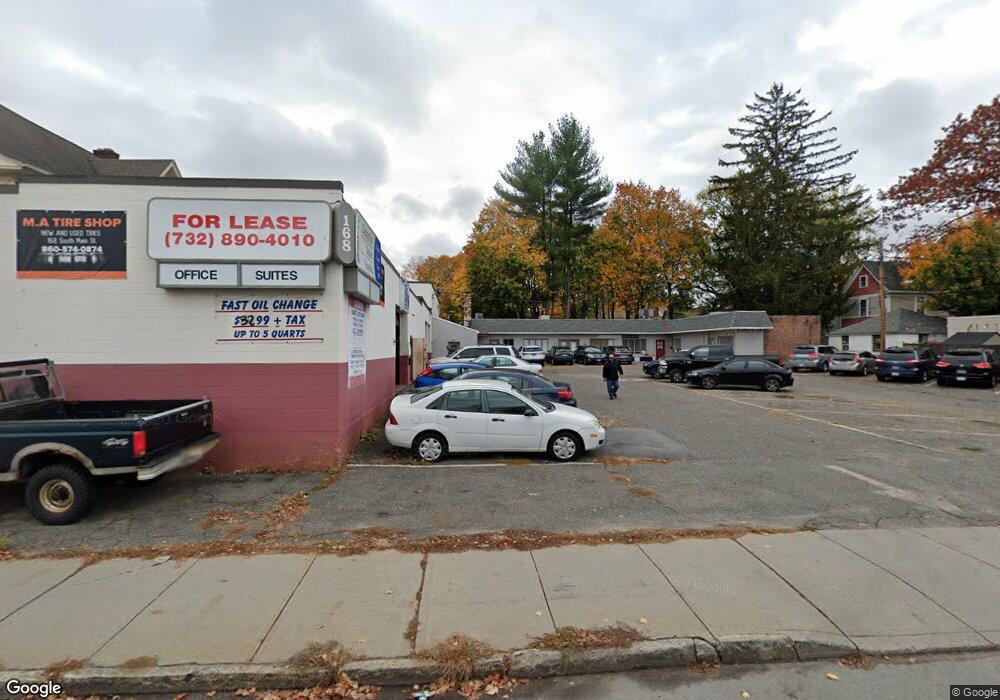
168 S Main St Torrington, CT 06790
Estimated Value: $407,492
Studio
--
Bath
11,177
Sq Ft
$36/Sq Ft
Est. Value
About This Home
This home is located at 168 S Main St, Torrington, CT 06790 and is currently estimated at $407,492, approximately $36 per square foot. 168 S Main St is a home located in Litchfield County with nearby schools including Torrington Middle School, Torrington High School, and St. Peter School.
Ownership History
Date
Name
Owned For
Owner Type
Purchase Details
Closed on
Oct 25, 2023
Sold by
Nguyen Thao and Tran Melissa
Bought by
2018 Vanessa Tran Llc
Current Estimated Value
Purchase Details
Closed on
Oct 18, 2023
Sold by
Wendy and Wendy Mike Torrington
Bought by
Nguyen Thao and Tran Melissa
Purchase Details
Closed on
Mar 28, 2018
Sold by
Hillcrest Land Co Llc
Bought by
Chung Investments Llc
Home Financials for this Owner
Home Financials are based on the most recent Mortgage that was taken out on this home.
Original Mortgage
$240,000
Interest Rate
4.38%
Mortgage Type
New Conventional
Purchase Details
Closed on
Sep 20, 2004
Sold by
Dipippo Joseph
Bought by
Orsini John and Orsini Stella C
Home Financials for this Owner
Home Financials are based on the most recent Mortgage that was taken out on this home.
Original Mortgage
$200,000
Interest Rate
6.41%
Mortgage Type
Commercial
Purchase Details
Closed on
Aug 24, 1993
Sold by
Fdic
Bought by
Dipippo Joseph
Home Financials for this Owner
Home Financials are based on the most recent Mortgage that was taken out on this home.
Original Mortgage
$82,000
Interest Rate
7.11%
Mortgage Type
Commercial
Create a Home Valuation Report for This Property
The Home Valuation Report is an in-depth analysis detailing your home's value as well as a comparison with similar homes in the area
Home Values in the Area
Average Home Value in this Area
Purchase History
We collect this data history from publicly available records. To have your information removed, we recommend requesting removal directly through your county’s website.
| Date | Buyer | Sale Price | Title Company |
|---|---|---|---|
| 2018 Vanessa Tran Llc | -- | None Available | |
| Nguyen Thao | $340,000 | None Available | |
| Chung Investments Llc | $320,000 | -- | |
| Orsini John | $375,000 | -- | |
| Dipippo Joseph | $77,000 | -- |
Source: Public Records
Mortgage History
We collect this data history from publicly available records. To have your information removed, we recommend requesting removal directly through your county’s website.
| Date | Status | Borrower | Loan Amount |
|---|---|---|---|
| Previous Owner | Dipippo Joseph | $240,000 | |
| Previous Owner | Dipippo Joseph | $200,000 | |
| Previous Owner | Dipippo Joseph | $82,000 |
Source: Public Records
Tax History
| Year | Tax Paid | Tax Assessment Tax Assessment Total Assessment is a certain percentage of the fair market value that is determined by local assessors to be the total taxable value of land and additions on the property. | Land | Improvement |
|---|---|---|---|---|
| 2025 | $10,217 | $265,720 | $50,400 | $215,320 |
| 2024 | $11,773 | $245,430 | $59,860 | $185,570 |
| 2023 | $11,771 | $245,430 | $59,860 | $185,570 |
| 2022 | $11,570 | $245,430 | $59,860 | $185,570 |
| 2021 | $11,332 | $245,430 | $59,860 | $185,570 |
| 2020 | $11,332 | $245,430 | $59,860 | $185,570 |
| 2019 | $11,964 | $259,140 | $57,260 | $201,880 |
| 2018 | $11,964 | $259,140 | $57,260 | $201,880 |
| 2017 | $11,856 | $259,140 | $57,260 | $201,880 |
| 2016 | $11,856 | $259,140 | $57,260 | $201,880 |
| 2015 | $11,856 | $259,140 | $57,260 | $201,880 |
| 2014 | $11,808 | $325,100 | $73,770 | $251,330 |
Source: Public Records
Map
Nearby Homes
- 264 S Main St
- 68 Wilson Ave Unit 103
- 68 Wilson Ave Unit 105
- 46 Prospect St
- 280 Park Ave
- 24 Summer St
- 160 New Litchfield St
- 112 Linden St
- 350 High St
- 21 Roosevelt Ave
- 28 Maple St
- 46 Raiano St
- 84 Jackson St
- 64 Hoffman St
- 377 Harwinton Ave
- 00 Church St
- 83 Birge St
- 147 Funston Ave
- 153 Funston Ave
- 121 View St
Your Personal Tour Guide
Ask me questions while you tour the home.