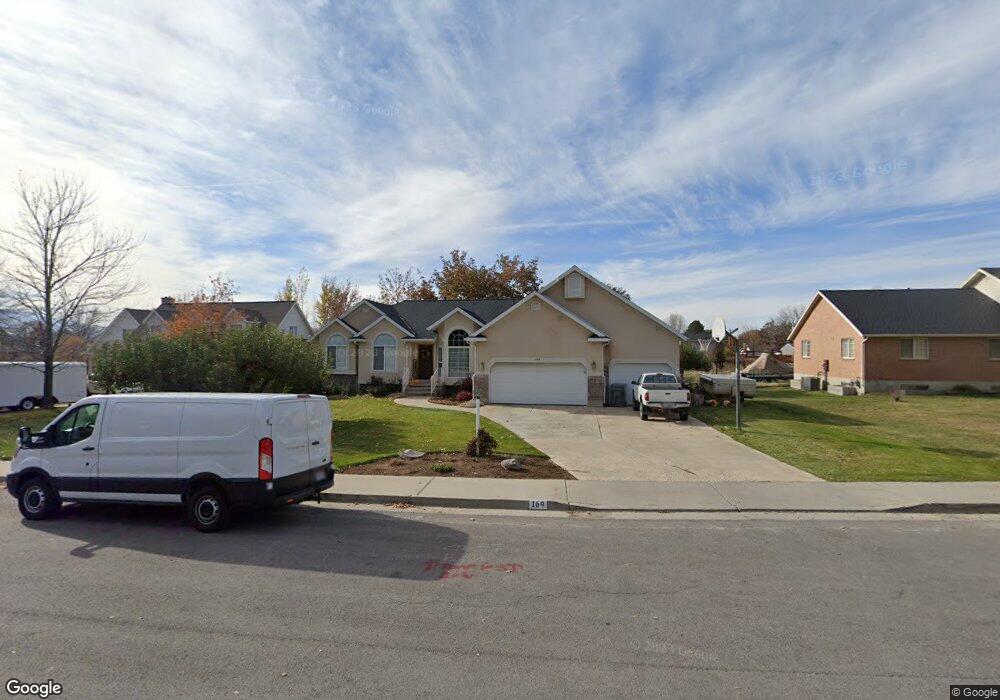
169 N 1000 E Mapleton, UT 84664
Estimated Value: $835,000 - $1,020,000
6
Beds
3
Baths
4,033
Sq Ft
$220/Sq Ft
Est. Value
About This Home
This home is located at 169 N 1000 E, Mapleton, UT 84664 and is currently estimated at $888,497, approximately $220 per square foot. 169 N 1000 E is a home located in Utah County with nearby schools including Mapleton School, Mapleton Junior High School, and Maple Mountain High School.
Ownership History
Date
Name
Owned For
Owner Type
Purchase Details
Closed on
Dec 18, 1998
Sold by
Thayne Gordon
Bought by
Thayne James Preston and Thayne Kim
Current Estimated Value
Purchase Details
Closed on
Jan 14, 1998
Sold by
Campbell Ruth Bartlett and Collett Ruth Campbell
Bought by
Newell Steven P and Newell Melanie F
Home Financials for this Owner
Home Financials are based on the most recent Mortgage that was taken out on this home.
Original Mortgage
$224,105
Outstanding Balance
$37,613
Interest Rate
7.14%
Estimated Equity
$850,884
Purchase Details
Closed on
Nov 14, 1997
Sold by
Campbell Timothy Roger
Bought by
Collett Ruth Bartlett
Purchase Details
Closed on
Dec 13, 1996
Sold by
Thayne Gordon E
Bought by
Thayne Gordon
Create a Home Valuation Report for This Property
The Home Valuation Report is an in-depth analysis detailing your home's value as well as a comparison with similar homes in the area
Home Values in the Area
Average Home Value in this Area
Purchase History
| Date | Buyer | Sale Price | Title Company |
|---|---|---|---|
| Thayne James Preston | -- | Equity Title Agency Inc | |
| Newell Steven P | -- | -- | |
| Collett Ruth Bartlett | -- | -- | |
| Thayne Gordon | -- | -- |
Source: Public Records
Mortgage History
| Date | Status | Borrower | Loan Amount |
|---|---|---|---|
| Open | Newell Steven P | $224,105 |
Source: Public Records
Tax History
| Year | Tax Paid | Tax Assessment Tax Assessment Total Assessment is a certain percentage of the fair market value that is determined by local assessors to be the total taxable value of land and additions on the property. | Land | Improvement |
|---|---|---|---|---|
| 2025 | $3,781 | $413,435 | -- | -- |
| 2024 | $3,781 | $370,425 | $0 | $0 |
| 2023 | $3,928 | $387,255 | $0 | $0 |
| 2022 | $4,214 | $410,795 | $0 | $0 |
| 2021 | $3,535 | $529,100 | $196,600 | $332,500 |
| 2020 | $3,499 | $506,500 | $174,000 | $332,500 |
| 2019 | $3,222 | $476,100 | $167,000 | $309,100 |
| 2018 | $2,924 | $411,300 | $140,600 | $270,700 |
| 2017 | $2,793 | $208,505 | $0 | $0 |
| 2016 | $2,708 | $200,915 | $0 | $0 |
| 2015 | $2,626 | $193,655 | $0 | $0 |
| 2014 | $2,584 | $187,165 | $0 | $0 |
Source: Public Records
Map
Nearby Homes
- 162 N 800 E
- 310 N 800 E
- 745 E Maple St
- 1377 E Maple St
- 141 N 600 E
- 415 E Maple St
- 775 N 800 E
- 1515 E Maple St
- 265 E 600 N
- 4021 S Ironwood Ln Unit 428
- 4886 S Englemann Ln Unit 525
- 2254 715 S Unit 60
- 4013 S Ironwood Ln Unit 432
- 4014 S Ironwood Ln
- 4001 S Ironwood Ln Unit 438
- 2254 715 S
- 4012 S Ironwood Ln Unit 424
- 2042 715 S Unit 57
- 4019 S Ironwood Ln Unit 429
- 2042 715 S
Your Personal Tour Guide
Ask me questions while you tour the home.