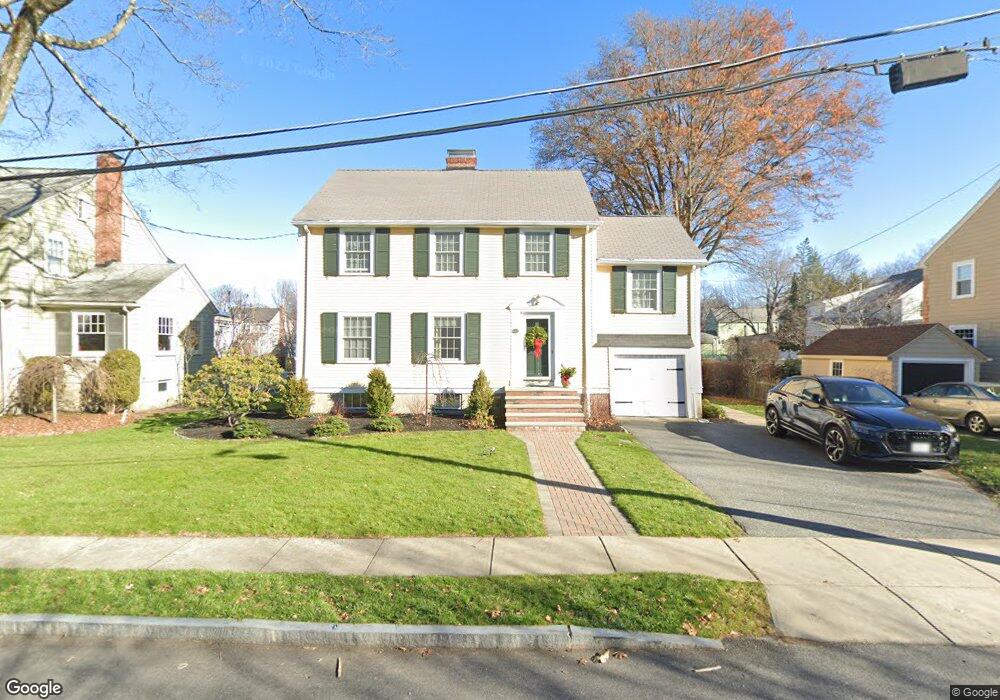
17 Broad St Belmont, MA 02478
Belmont Center NeighborhoodEstimated Value: $1,613,000 - $2,392,000
4
Beds
5
Baths
3,284
Sq Ft
$622/Sq Ft
Est. Value
About This Home
This home is located at 17 Broad St, Belmont, MA 02478 and is currently estimated at $2,042,346, approximately $621 per square foot. 17 Broad St is a home located in Middlesex County with nearby schools including Winn Brook Elementary School, Winthrop L Chenery Middle School, and Belmont High School.
Ownership History
Date
Name
Owned For
Owner Type
Purchase Details
Closed on
Jan 6, 2024
Sold by
Quinn Ted D and Quinn Cara W
Bought by
Quinn
Current Estimated Value
Purchase Details
Closed on
Mar 31, 2010
Sold by
Carter Bob S and Carter Jennifer E
Bought by
Quinn Ted D and Quinn Cara W
Home Financials for this Owner
Home Financials are based on the most recent Mortgage that was taken out on this home.
Original Mortgage
$415,000
Interest Rate
4.94%
Mortgage Type
Purchase Money Mortgage
Purchase Details
Closed on
Oct 8, 1999
Sold by
Matz Ruth G
Bought by
Carter Bob S and Carter Jennifer E
Home Financials for this Owner
Home Financials are based on the most recent Mortgage that was taken out on this home.
Original Mortgage
$427,500
Interest Rate
7.81%
Mortgage Type
Purchase Money Mortgage
Create a Home Valuation Report for This Property
The Home Valuation Report is an in-depth analysis detailing your home's value as well as a comparison with similar homes in the area
Home Values in the Area
Average Home Value in this Area
Purchase History
| Date | Buyer | Sale Price | Title Company |
|---|---|---|---|
| Quinn | -- | None Available | |
| Quinn Ted D | $1,020,000 | -- | |
| Carter Bob S | $450,000 | -- |
Source: Public Records
Mortgage History
| Date | Status | Borrower | Loan Amount |
|---|---|---|---|
| Previous Owner | Carter Bob S | $410,000 | |
| Previous Owner | Carter Bob S | $413,000 | |
| Previous Owner | Quinn Ted D | $415,000 | |
| Previous Owner | Carter Bob S | $427,500 |
Source: Public Records
Tax History
| Year | Tax Paid | Tax Assessment Tax Assessment Total Assessment is a certain percentage of the fair market value that is determined by local assessors to be the total taxable value of land and additions on the property. | Land | Improvement |
|---|---|---|---|---|
| 2025 | $23,031 | $2,022,000 | $814,000 | $1,208,000 |
| 2024 | $19,948 | $1,889,000 | $958,000 | $931,000 |
| 2023 | $20,625 | $1,835,000 | $957,000 | $878,000 |
| 2022 | $19,617 | $1,697,000 | $876,000 | $821,000 |
| 2021 | $18,810 | $1,630,000 | $867,000 | $763,000 |
| 2020 | $17,776 | $1,616,000 | $854,000 | $762,000 |
| 2019 | $15,801 | $1,354,000 | $661,000 | $693,000 |
| 2018 | $15,576 | $1,282,000 | $595,000 | $687,000 |
| 2017 | $15,583 | $1,228,000 | $546,000 | $682,000 |
| 2016 | $13,954 | $1,111,000 | $546,000 | $565,000 |
| 2015 | $13,261 | $1,028,000 | $463,000 | $565,000 |
Source: Public Records
Map
Nearby Homes
- 490 Pleasant St
- 30 Stearns Rd
- 22 Garfield Rd
- 10 Radcliffe Rd
- 384 Brighton St
- 315 Lake St
- 9 Venner Rd
- 108 Radcliffe Rd
- 23 Centre Ave
- 28 Tyler Rd
- 62 Thomas St
- 95 Griswold St Unit 95
- 16 Cheswick Rd
- 23 Loomis St Unit 23
- 233 Rutledge Rd
- 232 Rutledge Rd
- 290 Orchard St
- 5 Putnam Rd
- 773 Concord Ave Unit 103
- 27 Mott St Unit 27A
Your Personal Tour Guide
Ask me questions while you tour the home.