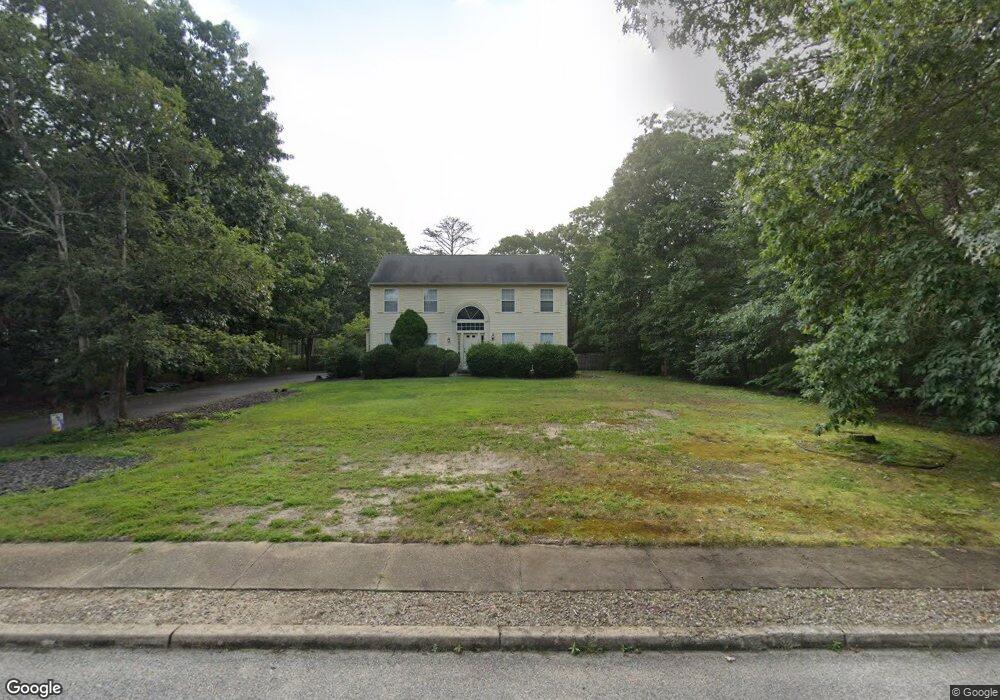
17 Chadwyn Dr Ocean View, NJ 08230
Estimated Value: $607,759 - $759,000
About This Home
This home is located at 17 Chadwyn Dr, Ocean View, NJ 08230 and is currently estimated at $682,690, approximately $265 per square foot. 17 Chadwyn Dr is a home located in Cape May County with nearby schools including Upper Township Primary School, Upper Township Elementary School, and Upper Township Middle School.
Ownership History
We collect this data history from publicly available records. To have your information removed, we recommend requesting removal directly through your county’s website.
Purchase Details
Home Financials for this Owner
Home Financials are based on the most recent Mortgage that was taken out on this home.Home Values in the Area
Average Home Value in this Area
Purchase History
We collect this data history from publicly available records. To have your information removed, we recommend requesting removal directly through your county’s website.
| Date | Buyer | Sale Price | Title Company |
|---|---|---|---|
| $236,000 | -- |
Mortgage History
We collect this data history from publicly available records. To have your information removed, we recommend requesting removal directly through your county’s website.
| Date | Status | Borrower | Loan Amount |
|---|---|---|---|
| Open | $120,000 |
Tax History
We collect this data history from publicly available records. To have your information removed, we recommend requesting removal directly through your county’s website.
| Year | Tax Paid | Tax Assessment Tax Assessment Total Assessment is a certain percentage of the fair market value that is determined by local assessors to be the total taxable value of land and additions on the property. | Land | Improvement |
|---|---|---|---|---|
| 2026 | $8,051 | $350,800 | $137,800 | $213,000 |
| 2025 | $8,051 | $350,800 | $137,800 | $213,000 |
| 2024 | $8,051 | $350,800 | $137,800 | $213,000 |
| 2023 | $7,654 | $350,800 | $137,800 | $213,000 |
| 2022 | $7,374 | $350,800 | $137,800 | $213,000 |
| 2021 | $5,263 | $350,800 | $137,800 | $213,000 |
| 2020 | $6,837 | $350,800 | $137,800 | $213,000 |
| 2019 | $6,655 | $350,800 | $137,800 | $213,000 |
| 2018 | $6,479 | $350,800 | $137,800 | $213,000 |
| 2017 | $6,399 | $350,800 | $137,800 | $213,000 |
| 2016 | $6,457 | $348,100 | $137,800 | $210,300 |
| 2015 | $6,283 | $348,100 | $137,800 | $210,300 |
| 2014 | $6,618 | $449,600 | $218,400 | $231,200 |
Map
- 11 Berwyn Dr
- 22 Black Oak Dr
- 1299 Stagecoach Rd
- 15 Red Oak Dr
- 19 Bayview Ave
- 19 Seaside Ave
- 2 Evio John Ct
- 1621 Route 9
- 129 Townsend Rd
- 7 Sandcastle Dr
- 734 Stagecoach Rd
- 24 E Timber Dr
- 14 Rivendell Rd
- 4 Sandcastle Dr
- 6 Hilltop Dr
- 3 Sandcastle Dr
- 11 Canterbury Ln
- 1731 Route 9 Unit 98
- 1731 Route 9 Unit 11
- 1731 Route 9 Unit 149
Ask me questions while you tour the home.