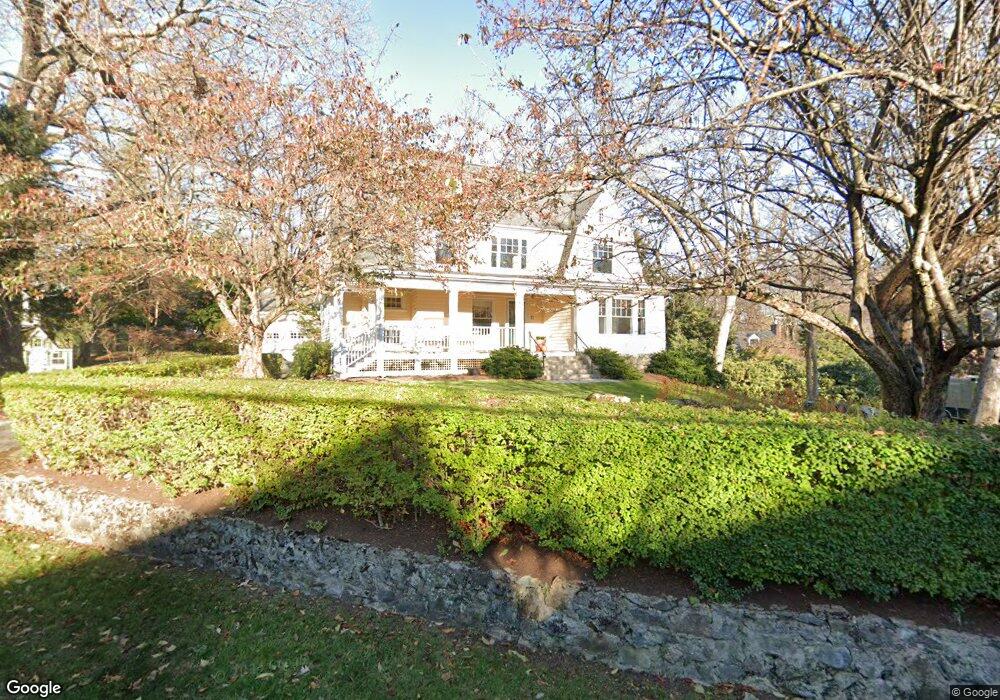
17 Cushing Rd Wellesley Hills, MA 02481
Cliff Estates NeighborhoodEstimated Value: $2,022,673 - $2,931,000
4
Beds
4
Baths
3,750
Sq Ft
$693/Sq Ft
Est. Value
About This Home
This home is located at 17 Cushing Rd, Wellesley Hills, MA 02481 and is currently estimated at $2,597,168, approximately $692 per square foot. 17 Cushing Rd is a home located in Norfolk County with nearby schools including Ernest F. Upham Elementary School, Wellesley Middle School, and Wellesley Sr High School.
Ownership History
Date
Name
Owned For
Owner Type
Purchase Details
Closed on
Feb 6, 1996
Sold by
Thomas John W and Thomas Bartlett L
Bought by
Goldberg David A
Current Estimated Value
Home Financials for this Owner
Home Financials are based on the most recent Mortgage that was taken out on this home.
Original Mortgage
$307,000
Interest Rate
7.25%
Mortgage Type
Purchase Money Mortgage
Purchase Details
Closed on
Oct 29, 1991
Sold by
Kelley Bruce L and Kelley Ella L
Bought by
Thomas John W
Home Financials for this Owner
Home Financials are based on the most recent Mortgage that was taken out on this home.
Original Mortgage
$250,000
Interest Rate
8.98%
Mortgage Type
Purchase Money Mortgage
Purchase Details
Closed on
Aug 1, 1989
Sold by
Cunningham Robert
Bought by
Kelley Bruce L
Create a Home Valuation Report for This Property
The Home Valuation Report is an in-depth analysis detailing your home's value as well as a comparison with similar homes in the area
Home Values in the Area
Average Home Value in this Area
Purchase History
| Date | Buyer | Sale Price | Title Company |
|---|---|---|---|
| Goldberg David A | $607,500 | -- | |
| Thomas John W | $570,000 | -- | |
| Kelley Bruce L | $570,000 | -- |
Source: Public Records
Mortgage History
| Date | Status | Borrower | Loan Amount |
|---|---|---|---|
| Open | Kelley Bruce L | $307,500 | |
| Closed | Kelley Bruce L | $307,000 | |
| Previous Owner | Kelley Bruce L | $297,000 | |
| Previous Owner | Kelley Bruce L | $250,000 |
Source: Public Records
Tax History
| Year | Tax Paid | Tax Assessment Tax Assessment Total Assessment is a certain percentage of the fair market value that is determined by local assessors to be the total taxable value of land and additions on the property. | Land | Improvement |
|---|---|---|---|---|
| 2025 | $17,157 | $1,669,000 | $1,248,000 | $421,000 |
| 2024 | $16,625 | $1,597,000 | $1,189,000 | $408,000 |
| 2023 | $15,812 | $1,381,000 | $1,053,000 | $328,000 |
| 2022 | $16,083 | $1,377,000 | $944,000 | $433,000 |
| 2021 | $15,710 | $1,337,000 | $904,000 | $433,000 |
| 2020 | $15,456 | $1,337,000 | $904,000 | $433,000 |
| 2019 | $15,469 | $1,337,000 | $904,000 | $433,000 |
| 2018 | $15,965 | $1,336,000 | $888,000 | $448,000 |
| 2017 | $15,751 | $1,336,000 | $888,000 | $448,000 |
| 2016 | $15,556 | $1,315,000 | $873,000 | $442,000 |
| 2015 | $15,201 | $1,315,000 | $873,000 | $442,000 |
Source: Public Records
Map
Nearby Homes
Your Personal Tour Guide
Ask me questions while you tour the home.