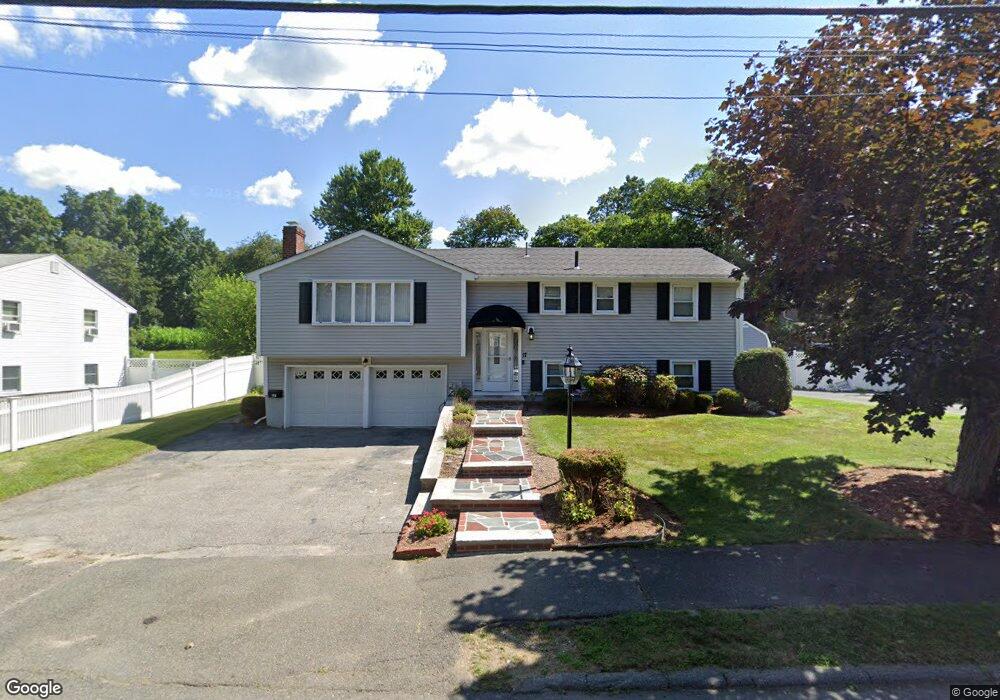
17 Danby Rd Stoneham, MA 02180
Lindenwood NeighborhoodEstimated Value: $809,000 - $876,630
3
Beds
3
Baths
1,971
Sq Ft
$433/Sq Ft
Est. Value
About This Home
This home is located at 17 Danby Rd, Stoneham, MA 02180 and is currently estimated at $853,658, approximately $433 per square foot. 17 Danby Rd is a home located in Middlesex County with nearby schools including Stoneham High School, St. Patrick Elementary School, and St Joseph School.
Ownership History
Date
Name
Owned For
Owner Type
Purchase Details
Closed on
Dec 12, 2020
Sold by
Bertolino Louis F
Bought by
L F Bertolino 2020 Ret
Current Estimated Value
Purchase Details
Closed on
Jun 15, 1967
Bought by
Bertolino Louis F
Create a Home Valuation Report for This Property
The Home Valuation Report is an in-depth analysis detailing your home's value as well as a comparison with similar homes in the area
Home Values in the Area
Average Home Value in this Area
Purchase History
We collect this data history from publicly available records. To have your information removed, we recommend requesting removal directly through your county’s website.
| Date | Buyer | Sale Price | Title Company |
|---|---|---|---|
| L F Bertolino 2020 Ret | -- | None Available | |
| Bertolino Louis F | -- | -- |
Source: Public Records
Mortgage History
We collect this data history from publicly available records. To have your information removed, we recommend requesting removal directly through your county’s website.
| Date | Status | Borrower | Loan Amount |
|---|---|---|---|
| Previous Owner | Bertolino Louis F | $150,000 | |
| Previous Owner | Bertolino Louis F | $90,000 |
Source: Public Records
Tax History
| Year | Tax Paid | Tax Assessment Tax Assessment Total Assessment is a certain percentage of the fair market value that is determined by local assessors to be the total taxable value of land and additions on the property. | Land | Improvement |
|---|---|---|---|---|
| 2025 | $7,910 | $773,200 | $400,800 | $372,400 |
| 2024 | $7,588 | $716,500 | $370,800 | $345,700 |
| 2023 | $7,366 | $663,600 | $340,800 | $322,800 |
| 2022 | $6,482 | $622,700 | $320,800 | $301,900 |
| 2021 | $6,107 | $574,500 | $290,800 | $283,700 |
| 2020 | $6,137 | $568,800 | $280,800 | $288,000 |
| 2019 | $6,140 | $547,200 | $260,800 | $286,400 |
| 2018 | $4,609 | $496,400 | $240,800 | $255,600 |
| 2017 | $5,401 | $445,400 | $230,800 | $214,600 |
| 2016 | $5,480 | $431,500 | $230,800 | $200,700 |
| 2015 | $5,610 | $432,900 | $230,800 | $202,100 |
| 2014 | $5,391 | $399,600 | $210,800 | $188,800 |
Source: Public Records
Map
Nearby Homes
- 3 Spruce St
- 28 Myopia Rd
- 2 O'Connor Ln
- 63 Oak St
- 57 Augustus Ct Unit 1010
- 305 Salem St Unit 203
- 122 Main St Unit 100
- 159 Main St Unit 47C
- 159 Main St Unit 23C
- 68 Main St Unit 58C
- 23 Augustus Ct Unit 4003
- 11 Isola Ln
- 100 Ledgewood Dr Unit 410
- 141 Pine Ridge Rd
- 13 Munroe Ave
- 33 Old Farm Rd
- 115 Collincote St
- 62 High St Unit Lot 7
- 94 William St
- 24 Montvale Ave
Your Personal Tour Guide
Ask me questions while you tour the home.