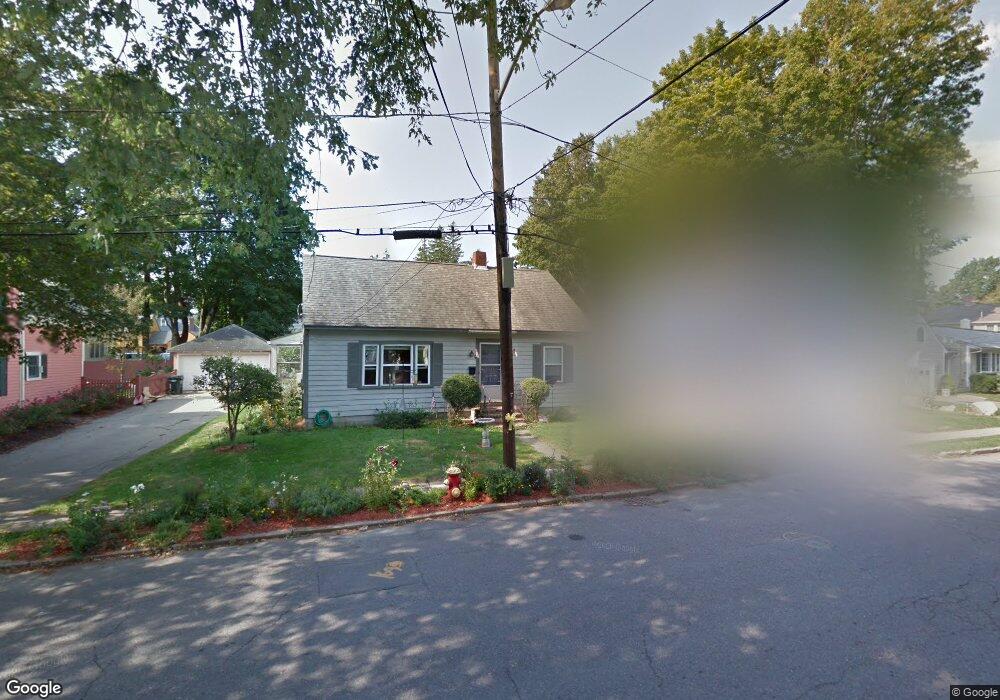
17 Eagle St Newburyport, MA 01950
Estimated Value: $517,000 - $855,000
About This Home
This home is located at 17 Eagle St, Newburyport, MA 01950 and is currently estimated at $690,923, approximately $759 per square foot. 17 Eagle St is a home located in Essex County with nearby schools including Francis T. Bresnahan Elementary School, Edward G. Molin Elementary School, and Rupert A. Nock Middle School.
Ownership History
We collect this data history from publicly available records. To have your information removed, we recommend requesting removal directly through your county’s website.
Purchase Details
Purchase Details
Purchase Details
Home Financials for this Owner
Home Financials are based on the most recent Mortgage that was taken out on this home.Home Values in the Area
Average Home Value in this Area
Purchase History
We collect this data history from publicly available records. To have your information removed, we recommend requesting removal directly through your county’s website.
| Date | Buyer | Sale Price | Title Company |
|---|---|---|---|
| -- | -- | ||
| -- | -- | ||
| $48,000 | -- |
Mortgage History
We collect this data history from publicly available records. To have your information removed, we recommend requesting removal directly through your county’s website.
| Date | Status | Borrower | Loan Amount |
|---|---|---|---|
| Previous Owner | $34,500 | ||
| Previous Owner | $55,000 |
Tax History
We collect this data history from publicly available records. To have your information removed, we recommend requesting removal directly through your county’s website.
| Year | Tax Paid | Tax Assessment Tax Assessment Total Assessment is a certain percentage of the fair market value that is determined by local assessors to be the total taxable value of land and additions on the property. | Land | Improvement |
|---|---|---|---|---|
| 2025 | $5,224 | $545,300 | $366,500 | $178,800 |
| 2024 | $4,950 | $496,500 | $333,200 | $163,300 |
| 2023 | $4,689 | $436,600 | $289,700 | $146,900 |
| 2022 | $4,360 | $363,000 | $241,400 | $121,600 |
| 2021 | $4,269 | $337,700 | $219,500 | $118,200 |
| 2020 | $4,240 | $330,200 | $219,500 | $110,700 |
| 2019 | $4,209 | $321,800 | $219,500 | $102,300 |
| 2018 | $4,072 | $307,100 | $209,000 | $98,100 |
| 2017 | $3,941 | $293,000 | $199,100 | $93,900 |
| 2016 | $3,796 | $283,500 | $189,600 | $93,900 |
| 2015 | $3,659 | $274,300 | $189,600 | $84,700 |
Map
- 48 Carter St
- 220 High St Unit 3
- 10 Johnson St
- 33 Merrill St
- 31 Olive St Unit 31
- 4 Olive St
- 5 Boardman St Unit 5
- 150 Merrimac St Unit I
- 44 Washington St Unit A
- 126 Merrimac St Unit 9
- 110 Low St
- 8 Vernon Ct
- 32 Market St
- 36 Market St
- 4 Chapel St Unit A
- 1 Stanley Ave
- 58 Merrimac St Unit 3-5
- 54 Ashland St
- 11 Norman Ave
- 2 Elbow Ln Unit A
- 21 Eagle St
- 19 Eagle St
- 23 Eagle St Unit 5
- 252 High St
- 252r High St Unit SI ID1045448P
- 252r High St Unit ID1045448P
- 61 Carter St Unit 2
- 61 Carter St Unit 61
- 254 High St Unit 254
- 59 Carter St Unit 3
- 57 Carter St Unit 4
- 254 High St Unit 1
- 254 High St
- 248 High St
- 24 Eagle St
- 20 Eagle St
- 26 Eagle St
- 15 Eagle St
- 72 Warren St
- 246 High St
Ask me questions while you tour the home.