17 Fairview Dr Pawcatuck, CT 06379
Estimated Value: $459,000 - $494,000
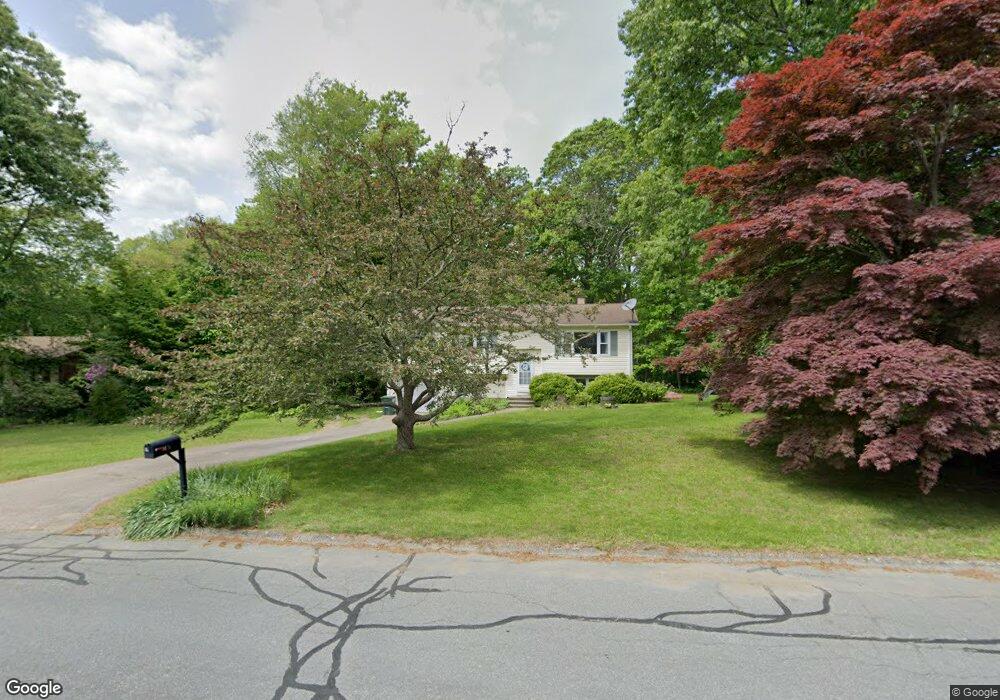
About This Home
This home is located at 17 Fairview Dr, Pawcatuck, CT 06379 and is currently estimated at $468,300, approximately $393 per square foot. 17 Fairview Dr is a home located in New London County with nearby schools including Stonington Middle School, Stonington High School, and North Stonington Christian Academy.
Ownership History
We collect this data history from publicly available records. To have your information removed, we recommend requesting removal directly through your county’s website.
Purchase Details
Purchase Details
Home Financials for this Owner
Home Financials are based on the most recent Mortgage that was taken out on this home.Purchase Details
Home Financials for this Owner
Home Financials are based on the most recent Mortgage that was taken out on this home.Purchase Details
Home Values in the Area
Average Home Value in this Area
Purchase History
We collect this data history from publicly available records. To have your information removed, we recommend requesting removal directly through your county’s website.
| Date | Buyer | Sale Price | Title Company |
|---|---|---|---|
| -- | None Available | ||
| -- | None Available | ||
| $243,900 | -- | ||
| $243,900 | -- | ||
| $251,000 | -- | ||
| $251,000 | -- | ||
| $237,000 | -- | ||
| $237,000 | -- |
Mortgage History
We collect this data history from publicly available records. To have your information removed, we recommend requesting removal directly through your county’s website.
| Date | Status | Borrower | Loan Amount |
|---|---|---|---|
| Previous Owner | $187,000 | ||
| Previous Owner | $1,951,005 |
Tax History
We collect this data history from publicly available records. To have your information removed, we recommend requesting removal directly through your county’s website.
| Year | Tax Paid | Tax Assessment Tax Assessment Total Assessment is a certain percentage of the fair market value that is determined by local assessors to be the total taxable value of land and additions on the property. | Land | Improvement |
|---|---|---|---|---|
| 2025 | $4,248 | $213,700 | $74,100 | $139,600 |
| 2024 | $4,071 | $213,700 | $74,100 | $139,600 |
| 2023 | $4,071 | $213,700 | $74,100 | $139,600 |
| 2022 | $4,172 | $160,500 | $66,800 | $93,700 |
| 2021 | $4,117 | $160,500 | $66,800 | $93,700 |
| 2020 | $4,038 | $160,500 | $66,800 | $93,700 |
| 2019 | $4,030 | $160,500 | $66,800 | $93,700 |
| 2018 | $3,894 | $160,500 | $66,800 | $93,700 |
| 2017 | $3,523 | $143,100 | $66,800 | $76,300 |
| 2016 | $3,427 | $143,100 | $66,800 | $76,300 |
| 2015 | $3,217 | $143,100 | $66,800 | $76,300 |
| 2014 | $3,147 | $143,100 | $66,800 | $76,300 |
Map
- 414 Liberty St
- 3 Arbor Ct
- 226 N Anguilla Rd
- #4, 421 Norwich Westerly Rd
- #17, 421 Norwich Westerly Rd
- #5, 421 Norwich Westerly Rd
- #7, 421 Norwich Westerly Rd
- #6, 421 Norwich Westerly Rd
- #9, 421 Norwich Westerly Rd
- #8, 421 Norwich Westerly Rd
- #11, 421 Norwich Westerly Rd
- 18 Billings St
- 0 Terrapat Dr
- 97 Liberty St
- 8 Perkins Ave
- 20 N Anguilla Rd
- 5 Benjamin St
- 3 Columbus Ave
- 305 Pequot Trail
- 7 Brookview Ct
- 41 Somersett Dr
- 10 Canterbury Ln
- 8 Canterbury Ln
- 35 Somersett Dr
- 6 Canterbury Ln
- 46 Somersett Dr
- 36 Somersett Dr
- 14 Somersett Dr
- 51 Somersett Dr
- 19 Fairview Dr
- 11 Canterbury Ln
- 28 Somersett Dr
- 12 Canterbury Ln
- 4 Canterbury Ln
- 16 Somersett Dr
- 52 Somersett Dr
- 15 Fairview Dr
- 9 Canterbury Ln
- 6 Somersett Dr
- 5 Nutmeg Rd
Ask me questions while you tour the home.