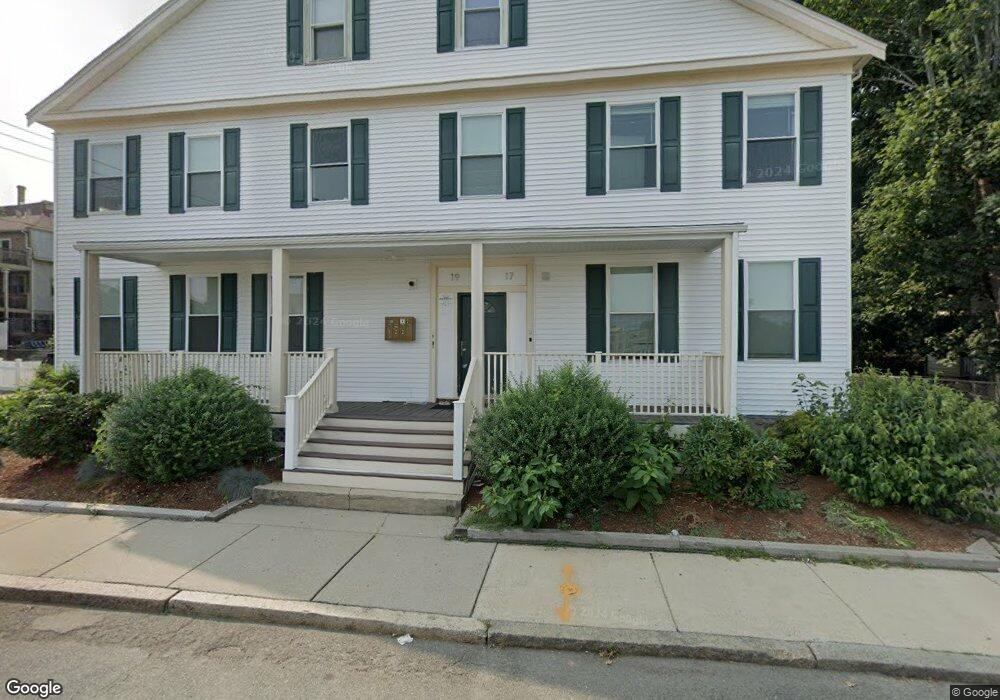
17 Lambert Ave Unit 19 Roxbury, MA 02119
Fort Hill NeighborhoodAbout This Home
(Avail Sept 1st) 3 bedroom 1.5 full bathrooms
----------------------------
Massive Basement
Laundry IN UNIT
Brand new kitchen/bathroom
Private off street parking
--------------------------
Huge Bedrooms
Hardwood Floors
Bay Windows
Very Sunny
Tons of space
----------------------
9/1/24
Great Location: Near the ORANGE Line, Dunkin, AK Pizza/Steak, Mike's Donuts, Lily's Gourmet Pasta, Penguin Pizza, Milk Weed, Crispy Dough, Pizza, Bars, Etc., Etc. Close to NORTHEASTERN, WENTWORTH, MassArt, MCPHS, Simmons, Emmanuel, Etc. Etc.
Call today to schedule a viewing or ask questions!
YSG RENTALS
Agent uses best efforts to advertise & market properties reflecting 100% accuracy. Pricing and availability is subject to change. Photos & Information provided depict the apartment's current condition and reflect to the best of the agent's knowledge ,the current apartment details pertaining to amenities, utilities, etc.
Home Values in the Area
Average Home Value in this Area
Property History
| Date | Event | Price | List to Sale | Price per Sq Ft |
|---|---|---|---|---|
| 02/15/2024 02/15/24 | Price Changed | $4,499 | 0.0% | $3 / Sq Ft |
| 02/04/2024 02/04/24 | For Rent | $4,499 | -- | -- |
Tax History
| Year | Tax Paid | Tax Assessment Tax Assessment Total Assessment is a certain percentage of the fair market value that is determined by local assessors to be the total taxable value of land and additions on the property. | Land | Improvement |
|---|---|---|---|---|
| 2025 | $12,513 | $1,080,600 | $243,800 | $836,800 |
| 2024 | $12,229 | $1,121,900 | $243,800 | $878,100 |
| 2023 | $12,260 | $1,141,500 | $243,800 | $897,700 |
| 2022 | $11,817 | $1,086,100 | $243,800 | $842,300 |
| 2021 | $11,544 | $1,081,900 | $203,100 | $878,800 |
| 2020 | $11,274 | $1,067,600 | $203,100 | $864,500 |
| 2019 | $10,904 | $1,034,500 | $203,100 | $831,400 |
| 2018 | $10,255 | $978,500 | $195,000 | $783,500 |
| 2017 | $9,960 | $940,500 | $178,700 | $761,800 |
| 2016 | $8,102 | $736,500 | $162,500 | $574,000 |
| 2015 | $7,311 | $603,700 | $159,700 | $444,000 |
| 2014 | $6,904 | $548,800 | $159,700 | $389,100 |
Map
- 19-21 Norfolk St Unit 1
- 27 Guild St Unit 301
- 27 Guild St Unit 106
- 15 Guild St Unit 302
- 10 Linwood St
- 3 Saint James Place Unit 3
- 10 Roxbury St
- 9 W Cedar St
- 27 Saint James St
- 39 Hawthorne St Unit 39
- 17 Akron St Unit 2
- 64 Alpine St Unit 104
- 78 Fort Ave Unit 78
- 4 Kearsarge Ave
- 63 Beech Glen St
- 113 Regent St
- 80 Terrace St Unit 501
- 187 Highland St
- 16 Taber St Unit 203
- 134 Terrace St
- 17 Lambert Ave Unit 2
- 17 Lambert Ave Unit 1
- 19 Lambert Ave Unit 4
- 19 Lambert Ave Unit 1
- 19 Lambert Ave
- 19 Lambert Ave Unit 2
- 5 Lambert Ave Unit 2
- 5 Lambert Ave
- 5 Lambert Ave Unit 1
- 14 Blanchard St
- 16 Blanchard St
- 51 Norfolk St
- 49 Norfolk St
- 23 Lambert Ave
- 60 Bartlett St Unit 3A
- 60 Bartlett St Unit 2A
- 60 Bartlett St Unit 1A
- 60 Bartlett St
- 60 Bartlett St Unit 1
- 60 Bartlett St Unit 3
Ask me questions while you tour the home.