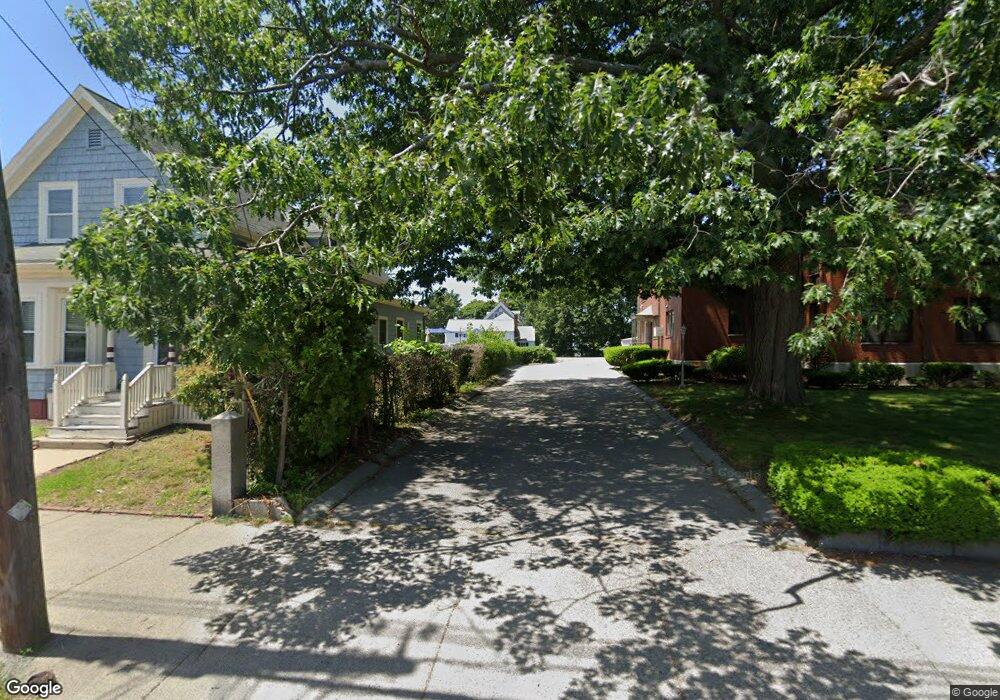
17 Mancini Ct Lynn, MA 01904
Lynn English NeighborhoodEstimated Value: $504,000 - $629,153
About This Home
This home is located at 17 Mancini Ct, Lynn, MA 01904 and is currently estimated at $588,788, approximately $349 per square foot. 17 Mancini Ct is a home located in Essex County with nearby schools including Edward A. Sisson Elementary School, William R. Fallon School, and Pickering Middle School.
Ownership History
We collect this data history from publicly available records. To have your information removed, we recommend requesting removal directly through your county’s website.
Purchase Details
Home Values in the Area
Average Home Value in this Area
Purchase History
We collect this data history from publicly available records. To have your information removed, we recommend requesting removal directly through your county’s website.
| Date | Buyer | Sale Price | Title Company |
|---|---|---|---|
| -- | -- |
Mortgage History
We collect this data history from publicly available records. To have your information removed, we recommend requesting removal directly through your county’s website.
| Date | Status | Borrower | Loan Amount |
|---|---|---|---|
| Open | $10,000 | ||
| Open | $200,000 | ||
| Closed | $120,000 | ||
| Closed | $90,000 | ||
| Closed | $35,000 |
Tax History
We collect this data history from publicly available records. To have your information removed, we recommend requesting removal directly through your county’s website.
| Year | Tax Paid | Tax Assessment Tax Assessment Total Assessment is a certain percentage of the fair market value that is determined by local assessors to be the total taxable value of land and additions on the property. | Land | Improvement |
|---|---|---|---|---|
| 2025 | $5,874 | $567,000 | $210,500 | $356,500 |
| 2024 | $5,637 | $535,300 | $205,800 | $329,500 |
| 2023 | $5,399 | $484,200 | $193,400 | $290,800 |
| 2022 | $5,378 | $432,700 | $160,100 | $272,600 |
| 2021 | $4,980 | $382,200 | $145,900 | $236,300 |
| 2020 | $4,756 | $354,900 | $131,500 | $223,400 |
| 2019 | $4,816 | $336,800 | $123,800 | $213,000 |
| 2018 | $4,542 | $299,800 | $115,300 | $184,500 |
| 2017 | $4,430 | $284,000 | $113,100 | $170,900 |
| 2016 | $4,128 | $255,100 | $94,100 | $161,000 |
| 2015 | $4,154 | $248,000 | $105,500 | $142,500 |
Map
- 10 Pond St
- 119 Bowler St
- 2 Chestnut Terrace
- 21 Dennison Ave
- 154-156 Tracy Ave
- 40 Carter Rd
- 48 Carter Rd
- 30 Linden Terrace
- 5 Morrill Place
- 28 Hawthorne St
- 57 Allen Ave
- 50-52 Allen Ave
- 26 Glenwood St
- 94 Eutaw Ave
- 7 Boynton St
- 431-433 Chatham St
- 48 Saratoga St
- 24 Sylvia St
- 19 Boynton St
- 11 Fernwood Ave
- 227 Maple St
- 231 Maple St
- 223 Maple St
- 12 Ramsdell Place
- 15 Ramsdell Place
- 222 Maple St Unit 224
- 243 Maple St
- 232-234 Maple St
- 220 Maple St
- 220 Maple St Unit 1
- 220 Maple St Unit 2
- 8 Ramsdell Place
- 222-224 Maple St
- 232 Maple St Unit 234
- 7 Ramsdell Place
- 245 Maple St
- 60 Bowler St
- 50 Bowler St
- 64 Bowler St
- 56 Bowler St
Ask me questions while you tour the home.