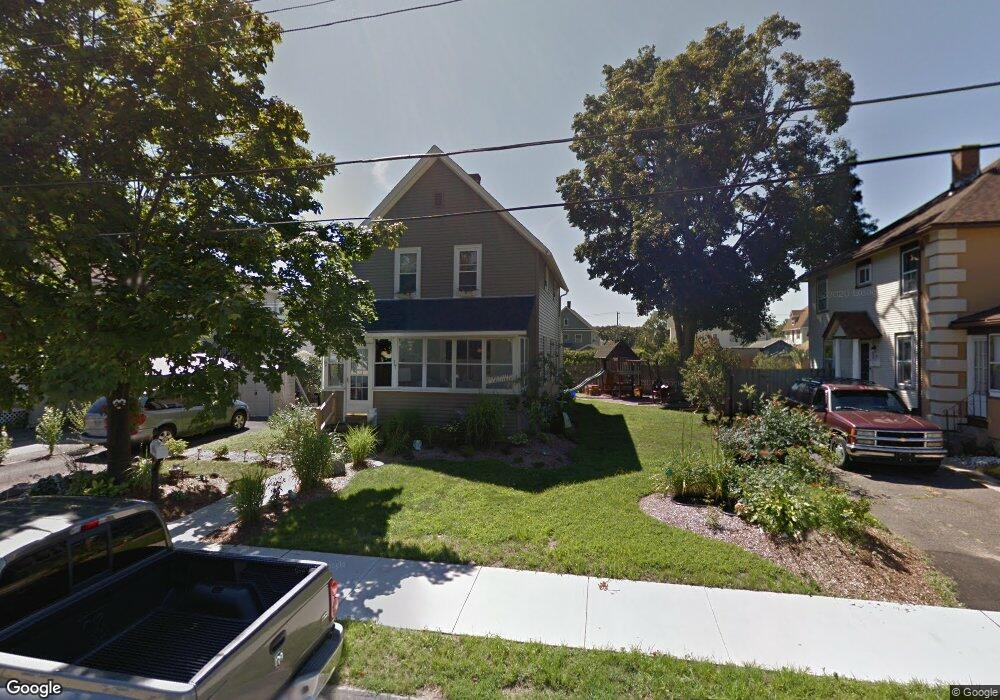
17 Maple St Ludlow, MA 01056
Estimated Value: $287,000 - $311,000
3
Beds
1
Bath
1,215
Sq Ft
$246/Sq Ft
Est. Value
About This Home
This home is located at 17 Maple St, Ludlow, MA 01056 and is currently estimated at $299,073, approximately $246 per square foot. 17 Maple St is a home located in Hampden County with nearby schools including East Street Elementary School, Chapin Street Elementary School, and Paul R. Baird Middle School.
Ownership History
Date
Name
Owned For
Owner Type
Purchase Details
Closed on
Jun 19, 1998
Sold by
Goncalves Domingos and Goncalves Elizabeth J
Bought by
Vital Eduardo M and Vital Julie C
Current Estimated Value
Home Financials for this Owner
Home Financials are based on the most recent Mortgage that was taken out on this home.
Original Mortgage
$87,150
Outstanding Balance
$17,495
Interest Rate
7.09%
Mortgage Type
Purchase Money Mortgage
Estimated Equity
$281,578
Purchase Details
Closed on
Jan 13, 1989
Sold by
Soares Judith
Bought by
Goncalves Domingos
Create a Home Valuation Report for This Property
The Home Valuation Report is an in-depth analysis detailing your home's value as well as a comparison with similar homes in the area
Home Values in the Area
Average Home Value in this Area
Purchase History
| Date | Buyer | Sale Price | Title Company |
|---|---|---|---|
| Vital Eduardo M | $87,250 | -- | |
| Vital Eduardo M | $87,250 | -- | |
| Goncalves Domingos | $99,900 | -- | |
| Goncalves Domingos | $99,900 | -- |
Source: Public Records
Mortgage History
| Date | Status | Borrower | Loan Amount |
|---|---|---|---|
| Open | Goncalves Domingos | $87,150 | |
| Closed | Goncalves Domingos | $87,150 |
Source: Public Records
Tax History
| Year | Tax Paid | Tax Assessment Tax Assessment Total Assessment is a certain percentage of the fair market value that is determined by local assessors to be the total taxable value of land and additions on the property. | Land | Improvement |
|---|---|---|---|---|
| 2025 | $3,505 | $202,000 | $70,800 | $131,200 |
| 2024 | $3,392 | $187,500 | $70,800 | $116,700 |
| 2023 | $3,207 | $164,400 | $62,100 | $102,300 |
| 2022 | $3,070 | $153,600 | $62,100 | $91,500 |
| 2021 | $3,092 | $146,700 | $62,100 | $84,600 |
| 2020 | $2,965 | $143,800 | $61,200 | $82,600 |
| 2019 | $2,769 | $139,700 | $60,600 | $79,100 |
| 2018 | $2,601 | $136,800 | $60,600 | $76,200 |
| 2017 | $2,489 | $134,300 | $58,800 | $75,500 |
| 2016 | $2,362 | $130,300 | $57,600 | $72,700 |
| 2015 | $2,218 | $128,300 | $57,000 | $71,300 |
Source: Public Records
Map
Nearby Homes
- 39 Rogers Ave
- 0 Center St Unit 73415933
- 350 West Ave Unit 5
- 162 Highland Ave
- 38 Prospect St
- 31 Greenwich St
- 259 Prospect St
- 53 Waters Edge
- 107 Enfield St
- 37 Franklin St
- 37 Waters Edge Unit 37
- 98 Fuller St Unit 32
- 0 N S Main St Io
- 46-48 Milton St
- 295 Main St
- 365 Water St Unit 367
- 96 Lyons St
- 33 Connolly St
- 102 Swan Ave
- 101 Ray St
Your Personal Tour Guide
Ask me questions while you tour the home.