17 Peacock Dr Meriden, CT 06451
Meriden AreaEstimated Value: $270,000 - $303,000
About This Home
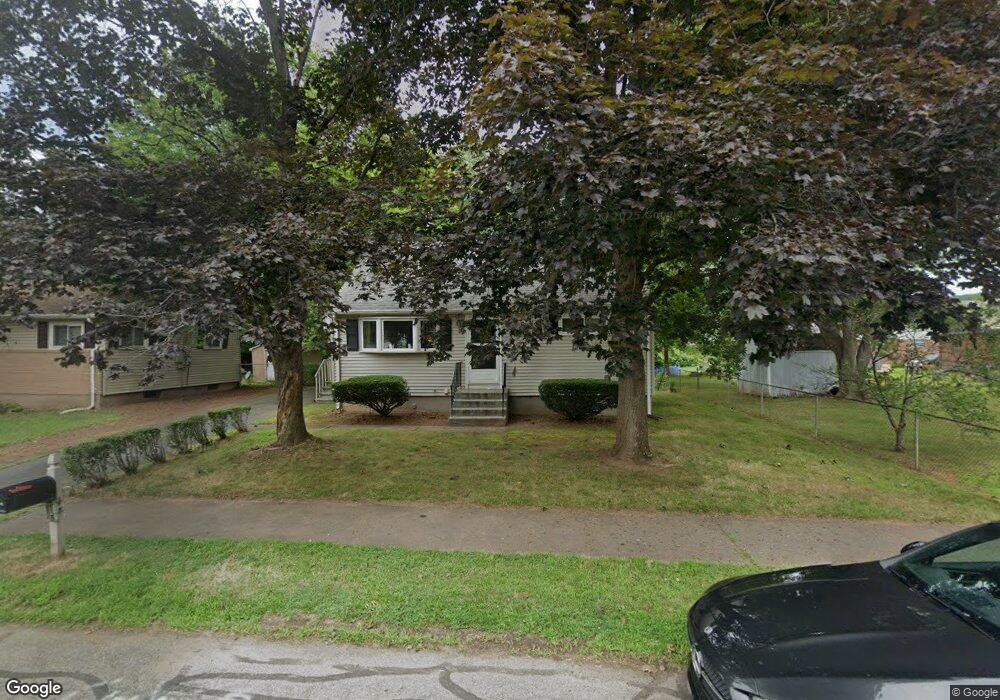
This home is located at 17 Peacock Dr, Meriden, CT 06451 and is currently estimated at $283,958, approximately $316 per square foot. 17 Peacock Dr is a home located in New Haven County with nearby schools including Benjamin Franklin School, Lincoln Middle School, and Orville H. Platt High School.
Ownership History
We collect this data history from publicly available records. To have your information removed, we recommend requesting removal directly through your county’s website.
Purchase Details
Home Values in the Area
Average Home Value in this Area
Purchase History
We collect this data history from publicly available records. To have your information removed, we recommend requesting removal directly through your county’s website.
| Date | Buyer | Sale Price | Title Company |
|---|---|---|---|
| -- | -- |
Mortgage History
We collect this data history from publicly available records. To have your information removed, we recommend requesting removal directly through your county’s website.
| Date | Status | Borrower | Loan Amount |
|---|---|---|---|
| Closed | $19,402 |
Tax History
We collect this data history from publicly available records. To have your information removed, we recommend requesting removal directly through your county’s website.
| Year | Tax Paid | Tax Assessment Tax Assessment Total Assessment is a certain percentage of the fair market value that is determined by local assessors to be the total taxable value of land and additions on the property. | Land | Improvement |
|---|---|---|---|---|
| 2025 | $4,157 | $103,670 | $36,890 | $66,780 |
| 2024 | $3,764 | $103,670 | $36,890 | $66,780 |
| 2023 | $3,607 | $103,670 | $36,890 | $66,780 |
| 2022 | $3,420 | $103,670 | $36,890 | $66,780 |
| 2021 | $3,504 | $85,750 | $30,520 | $55,230 |
| 2020 | $3,504 | $85,750 | $30,520 | $55,230 |
| 2019 | $3,232 | $79,100 | $30,520 | $48,580 |
| 2018 | $3,246 | $79,100 | $30,520 | $48,580 |
| 2017 | $3,158 | $79,100 | $30,520 | $48,580 |
| 2016 | $3,397 | $92,750 | $39,620 | $53,130 |
| 2015 | $3,397 | $92,750 | $39,620 | $53,130 |
| 2014 | $3,315 | $92,750 | $39,620 | $53,130 |
Map
- 222 Hamilton St
- 383 Glen Hills Rd
- 57 Buckingham St
- 18 Allen Ct Unit 7/G
- 33 Allen Ave
- 146 Lambert Ave
- 171 Oregon Rd
- 604 Brownstone Ridge
- 269 Highland Ave
- 30 Winthrop Terrace
- 670 Hanover Rd
- 237 Highland Ave
- 202 Glen Hills Rd
- 44 4th St
- 76 Columbus Ave
- 20 4th St
- 118 Columbus Ave
- 18 N 3rd St
- 56 N First St
- 153 Fiesta Heights
Ask me questions while you tour the home.