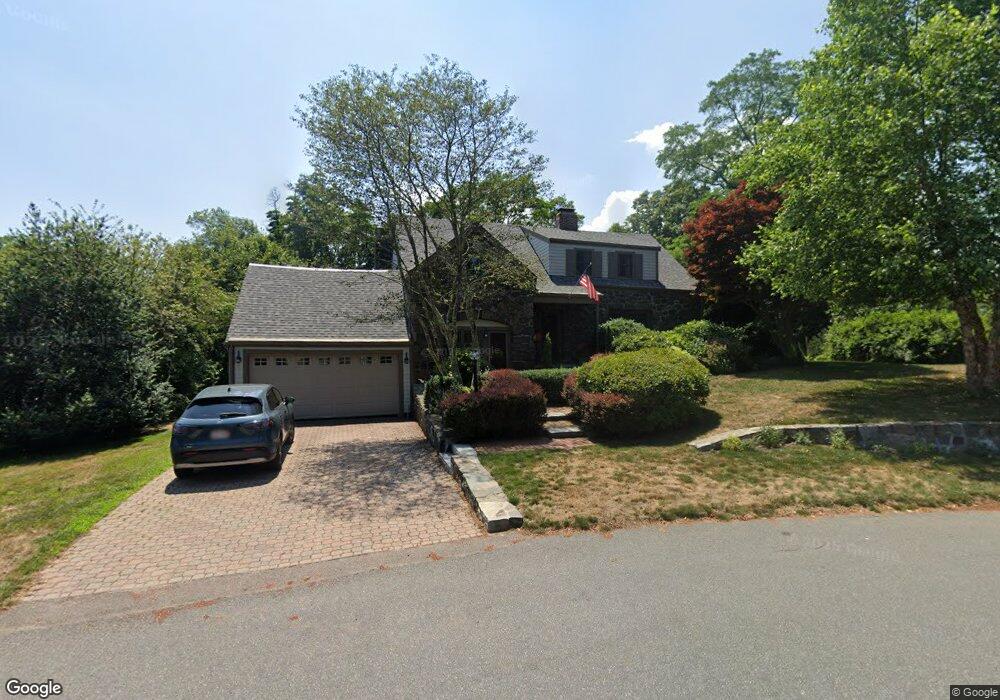
17 Ridge Rd Marblehead, MA 01945
Estimated Value: $1,307,000 - $1,439,000
3
Beds
4
Baths
2,433
Sq Ft
$574/Sq Ft
Est. Value
About This Home
This home is located at 17 Ridge Rd, Marblehead, MA 01945 and is currently estimated at $1,397,066, approximately $574 per square foot. 17 Ridge Rd is a home located in Essex County with nearby schools including Marblehead High School, Marblehead Community Charter Public School, and Tower School.
Ownership History
Date
Name
Owned For
Owner Type
Purchase Details
Closed on
Nov 7, 1991
Sold by
Paul Thomas C and Paul Janet M
Bought by
Feeney Stephen P and Feeney Margaret
Current Estimated Value
Home Financials for this Owner
Home Financials are based on the most recent Mortgage that was taken out on this home.
Original Mortgage
$191,200
Interest Rate
8.85%
Mortgage Type
Purchase Money Mortgage
Create a Home Valuation Report for This Property
The Home Valuation Report is an in-depth analysis detailing your home's value as well as a comparison with similar homes in the area
Home Values in the Area
Average Home Value in this Area
Purchase History
We collect this data history from publicly available records. To have your information removed, we recommend requesting removal directly through your county’s website.
| Date | Buyer | Sale Price | Title Company |
|---|---|---|---|
| Feeney Stephen P | $280,000 | -- | |
| Feeney Stephen P | $280,000 | -- |
Source: Public Records
Mortgage History
We collect this data history from publicly available records. To have your information removed, we recommend requesting removal directly through your county’s website.
| Date | Status | Borrower | Loan Amount |
|---|---|---|---|
| Open | Feeney Stephen P | $50,000 | |
| Closed | Feeney Stephen P | $25,000 | |
| Closed | Feeney Stephen P | $188,000 | |
| Closed | Feeney Stephen P | $191,200 |
Source: Public Records
Tax History
| Year | Tax Paid | Tax Assessment Tax Assessment Total Assessment is a certain percentage of the fair market value that is determined by local assessors to be the total taxable value of land and additions on the property. | Land | Improvement |
|---|---|---|---|---|
| 2025 | $11,185 | $1,235,900 | $864,100 | $371,800 |
| 2024 | $13,143 | $1,466,900 | $1,245,600 | $221,300 |
| 2023 | $9,290 | $929,000 | $686,200 | $242,800 |
| 2022 | $9,595 | $912,100 | $677,700 | $234,400 |
| 2021 | $8,798 | $844,300 | $609,900 | $234,400 |
| 2020 | $8,438 | $812,100 | $609,900 | $202,200 |
| 2019 | $8,334 | $776,000 | $576,000 | $200,000 |
| 2018 | $8,179 | $742,200 | $542,200 | $200,000 |
| 2017 | $7,611 | $691,300 | $491,300 | $200,000 |
| 2016 | $7,486 | $674,400 | $474,400 | $200,000 |
| 2015 | $6,953 | $627,500 | $440,500 | $187,000 |
| 2014 | $6,534 | $589,200 | $406,600 | $182,600 |
Source: Public Records
Map
Nearby Homes
- 82 Cornell Rd
- 2 Girdler Rd
- 282 Pleasant St
- 27 Maverick St
- 72 Village St
- 189 W Shore Dr
- 197A W Shore Dr Unit A
- 3 Devereux Terrace
- 1 Maverick St Unit 2
- 9 Cedar St
- 26 Cedar St Unit 2
- 9 Mount Vernon St
- 78 Garfield St
- 53 Sewall St
- 28 Orchard St
- 40 Prospect St Unit 3
- 290 Washington St Unit 2
- 2 Commercial St Unit 3
- 126 Pleasant St
- 18 Pickwick Rd
Your Personal Tour Guide
Ask me questions while you tour the home.