17 Rob Roy Rd Worcester, MA 01602
Newton Square NeighborhoodEstimated Value: $507,000 - $577,000
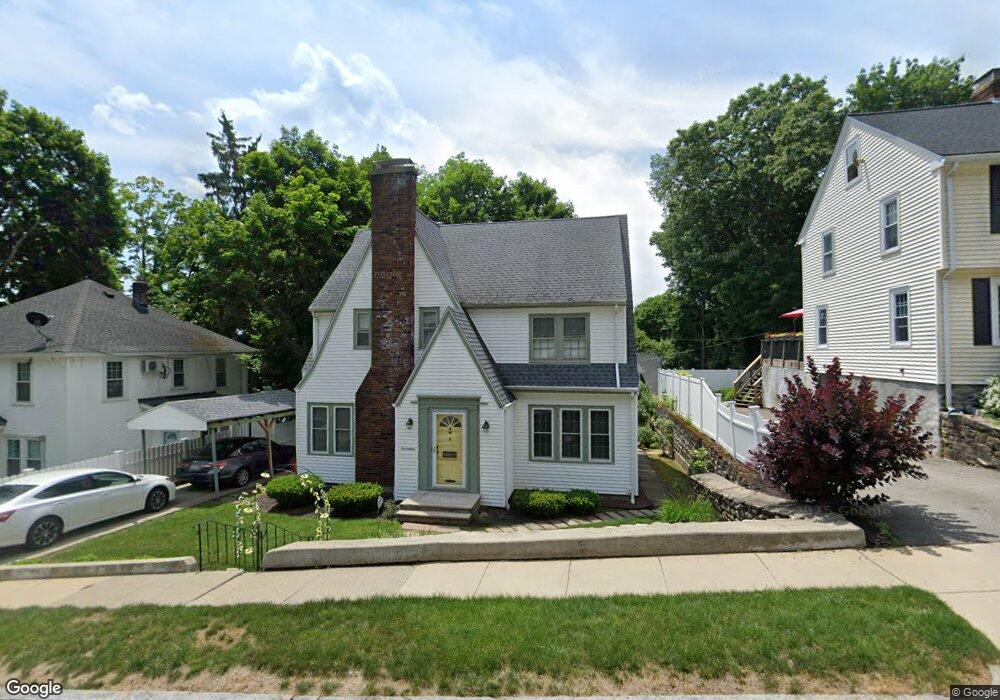
About This Home
This home is located at 17 Rob Roy Rd, Worcester, MA 01602 and is currently estimated at $530,894, approximately $264 per square foot. 17 Rob Roy Rd is a home located in Worcester County with nearby schools including Chandler Magnet, Jacob Hiatt Magnet School, and May Street Elementary School.
Ownership History
We collect this data history from publicly available records. To have your information removed, we recommend requesting removal directly through your county’s website.
Purchase Details
Purchase Details
Purchase Details
Home Values in the Area
Average Home Value in this Area
Purchase History
We collect this data history from publicly available records. To have your information removed, we recommend requesting removal directly through your county’s website.
| Date | Buyer | Sale Price | Title Company |
|---|---|---|---|
| $317,000 | -- | ||
| $214,750 | -- | ||
| $119,000 | -- |
Mortgage History
We collect this data history from publicly available records. To have your information removed, we recommend requesting removal directly through your county’s website.
| Date | Status | Borrower | Loan Amount |
|---|---|---|---|
| Closed | $217,985 | ||
| Closed | $250,000 | ||
| Closed | $50,000 | ||
| Closed | $214,200 | ||
| Previous Owner | $214,200 | ||
| Closed | $44,500 |
Tax History
We collect this data history from publicly available records. To have your information removed, we recommend requesting removal directly through your county’s website.
| Year | Tax Paid | Tax Assessment Tax Assessment Total Assessment is a certain percentage of the fair market value that is determined by local assessors to be the total taxable value of land and additions on the property. | Land | Improvement |
|---|---|---|---|---|
| 2025 | $6,036 | $457,600 | $113,700 | $343,900 |
| 2024 | $5,508 | $400,600 | $113,700 | $286,900 |
| 2023 | $5,299 | $369,500 | $98,900 | $270,600 |
| 2022 | $4,823 | $317,100 | $79,100 | $238,000 |
| 2021 | $4,780 | $293,600 | $63,300 | $230,300 |
| 2020 | $4,685 | $275,600 | $63,300 | $212,300 |
| 2019 | $4,450 | $247,200 | $56,900 | $190,300 |
| 2018 | $4,514 | $238,700 | $56,900 | $181,800 |
| 2017 | $4,253 | $221,300 | $56,900 | $164,400 |
| 2016 | $4,338 | $210,500 | $42,000 | $168,500 |
| 2015 | $4,225 | $210,500 | $42,000 | $168,500 |
| 2014 | $4,107 | $210,200 | $42,000 | $168,200 |
Map
- 26 Rob Roy Rd
- 55 Westview Rd
- 24 Hadwen Rd
- 10 Perrot St
- 12 Sherwood Rd
- 71 Morningside Rd
- 454 Chandler St
- 32 Westview Rd
- 20 Berkmans St
- 4 Hamill Rd
- 14 Tahanto Rd
- 1 Hadwen Ln
- 108 Longfellow Rd
- 128 S Flagg St
- 3 Franconia St
- 29 Courtland St
- 54 Midland St
- 4 Chamberlain Pkwy
- 3 Ureco Terrace
- 22 Longfellow Rd
Ask me questions while you tour the home.