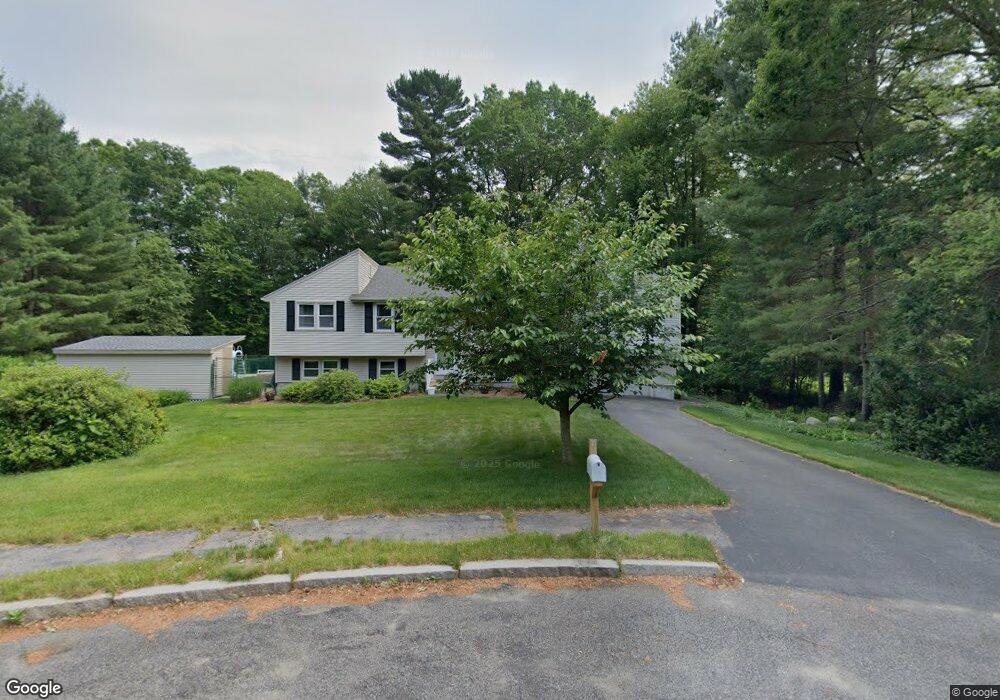
17 Rustic Dr Mansfield, MA 02048
Estimated Value: $686,000 - $743,000
About This Home
This home is located at 17 Rustic Dr, Mansfield, MA 02048 and is currently estimated at $722,238, approximately $376 per square foot. 17 Rustic Dr is a home located in Bristol County with nearby schools including Jordan/Jackson Elementary School, Everett W. Robinson Elementary School, and Harold L. Qualters Middle School.
Ownership History
We collect this data history from publicly available records. To have your information removed, we recommend requesting removal directly through your county’s website.
Purchase Details
Home Values in the Area
Average Home Value in this Area
Purchase History
We collect this data history from publicly available records. To have your information removed, we recommend requesting removal directly through your county’s website.
| Date | Buyer | Sale Price | Title Company |
|---|---|---|---|
| $45,800 | -- |
Mortgage History
We collect this data history from publicly available records. To have your information removed, we recommend requesting removal directly through your county’s website.
| Date | Status | Borrower | Loan Amount |
|---|---|---|---|
| Open | $135,000 | ||
| Closed | $30,000 | ||
| Closed | $100,000 | ||
| Closed | $40,000 |
Tax History
We collect this data history from publicly available records. To have your information removed, we recommend requesting removal directly through your county’s website.
| Year | Tax Paid | Tax Assessment Tax Assessment Total Assessment is a certain percentage of the fair market value that is determined by local assessors to be the total taxable value of land and additions on the property. | Land | Improvement |
|---|---|---|---|---|
| 2025 | $7,463 | $566,700 | $278,400 | $288,300 |
| 2024 | $7,709 | $571,000 | $290,500 | $280,500 |
| 2023 | $7,440 | $528,000 | $290,500 | $237,500 |
| 2022 | $7,227 | $476,400 | $268,900 | $207,500 |
| 2021 | $3,570 | $448,200 | $224,200 | $224,000 |
| 2020 | $6,706 | $436,600 | $224,200 | $212,400 |
| 2019 | $6,427 | $422,300 | $186,700 | $235,600 |
| 2018 | $0 | $409,100 | $178,100 | $231,000 |
| 2017 | $3,253 | $404,000 | $173,000 | $231,000 |
| 2016 | $5,776 | $374,800 | $164,700 | $210,100 |
| 2015 | $5,809 | $374,800 | $164,700 | $210,100 |
Map
- 779 Ware St
- 5 Juniper Dr
- 38 Fruit St
- 32 Millfarm Dr
- 387 Willow St
- 15 Conrod Ct
- 436 Reservoir St
- 0 Kensington Rd
- 37 Davis St Unit 2
- 631 East St Unit G202
- 631 East St Unit B201
- 14 Kendall Park
- 5 Kensington Rd
- 15 Reservoir St Unit 22
- 15 Reservoir St Unit 24
- 69 Union St
- 50 Hope St
- 298 Reservoir St
- 0 Cobb St
- 0 Knollwood & 0 Rear Kensington
Ask me questions while you tour the home.