Estimated Value: $449,002 - $590,000
3
Beds
2
Baths
1,760
Sq Ft
$283/Sq Ft
Est. Value
About This Home
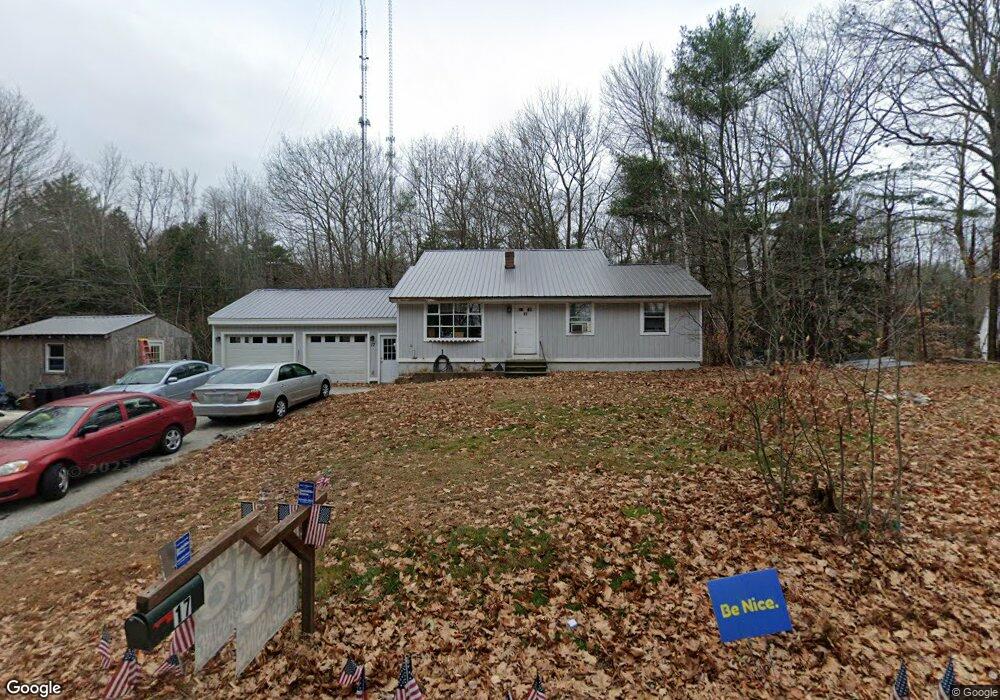
This home is located at 17 Upper Marginal Way, Gray, ME 04039 and is currently estimated at $498,251, approximately $283 per square foot. 17 Upper Marginal Way is a home located in Cumberland County with nearby schools including Gray-New Gloucester High School and Fiddlehead School of Arts & Science.
Ownership History
Date
Name
Owned For
Owner Type
Purchase Details
Closed on
Sep 29, 2006
Sold by
Blanchard Ronald J
Bought by
Yoder Rick A
Current Estimated Value
Home Financials for this Owner
Home Financials are based on the most recent Mortgage that was taken out on this home.
Original Mortgage
$199,800
Interest Rate
6.52%
Mortgage Type
Purchase Money Mortgage
Purchase Details
Closed on
Jul 10, 2006
Sold by
Blanchard Ronald J and Splude Michelle M
Bought by
Blanchard Ronald J
Create a Home Valuation Report for This Property
The Home Valuation Report is an in-depth analysis detailing your home's value as well as a comparison with similar homes in the area
Home Values in the Area
Average Home Value in this Area
Purchase History
| Date | Buyer | Sale Price | Title Company |
|---|---|---|---|
| Yoder Rick A | -- | -- | |
| Blanchard Ronald J | -- | -- |
Source: Public Records
Mortgage History
| Date | Status | Borrower | Loan Amount |
|---|---|---|---|
| Closed | Yoder Rick A | $199,800 |
Source: Public Records
Tax History
| Year | Tax Paid | Tax Assessment Tax Assessment Total Assessment is a certain percentage of the fair market value that is determined by local assessors to be the total taxable value of land and additions on the property. | Land | Improvement |
|---|---|---|---|---|
| 2025 | $3,933 | $406,300 | $119,800 | $286,500 |
| 2024 | $3,941 | $406,300 | $119,800 | $286,500 |
| 2023 | $3,276 | $215,800 | $55,100 | $160,700 |
| 2022 | $3,010 | $215,800 | $55,100 | $160,700 |
| 2021 | $2,957 | $202,400 | $55,100 | $147,300 |
| 2020 | $2,946 | $199,700 | $55,100 | $144,600 |
| 2019 | $2,946 | $199,700 | $55,100 | $144,600 |
| 2018 | $2,796 | $199,700 | $55,100 | $144,600 |
| 2017 | $3,025 | $167,600 | $43,000 | $124,600 |
| 2016 | $3,067 | $167,600 | $43,000 | $124,600 |
| 2015 | $3,050 | $167,600 | $43,000 | $124,600 |
| 2014 | $3,050 | $167,600 | $43,000 | $124,600 |
| 2012 | $2,622 | $165,411 | $43,000 | $122,411 |
Source: Public Records
Map
Nearby Homes
- 10 Aerie Dr
- Lot# 1 Summit Rd
- 3 Nautical Way Unit A
- 3 Two Lights Rd
- 138 Orchard Rd
- 38 Blackthorne Ln
- 22 Old Rd
- 1 Blackthorne Ln
- 0 Tavern Hill
- 0 Thomes Way
- 19 Woodcock Dr
- 60 Woodcock Dr
- 15 Woodcock Dr
- 22 Woodcock Dr
- 309 Blanchard Rd
- 52 Woodcock Dr
- 47 Woodcock Dr
- 14 Yarmouth Rd
- 21 Woodcock Dr
- 25 Yarmouth Rd
- 23 Upper Marginal Way
- 64 Upper Marginal Way
- 16 Upper Marginal Way
- 25 Upper Marginal Way
- TBD Map 64 Lot 35-28 Upper Margina
- 230 Portland Rd
- 11 Casey Ln
- 9 Upper Marginal Way
- 222 Portland Rd
- 232 Portland Rd
- 64-35-28-1 Upper Marginal Way
- 29 Upper Marginal Way
- 236 Portland Rd
- 00 Whitney Rd
- 6 Casey Ln
- 4 Eagle Nest Rd
- 4 Eagles Nest Rd
- 235 Portland Rd
- 12 Casey Ln
- 2 Whitney Rd
Your Personal Tour Guide
Ask me questions while you tour the home.