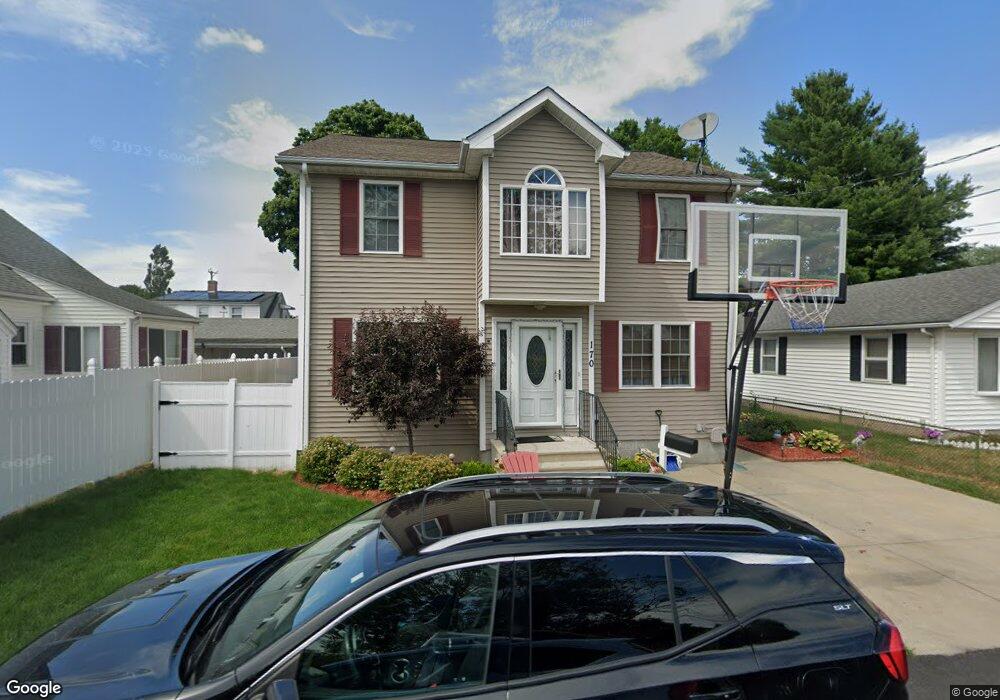
170 Fuller St Pawtucket, RI 02861
Darlington NeighborhoodEstimated Value: $444,000 - $531,000
About This Home
This home is located at 170 Fuller St, Pawtucket, RI 02861 and is currently estimated at $489,652, approximately $244 per square foot. 170 Fuller St is a home located in Providence County with nearby schools including Saint Teresa Catholic Elementary School and St Cecilia School.
Ownership History
We collect this data history from publicly available records. To have your information removed, we recommend requesting removal directly through your county’s website.
Purchase Details
Home Financials for this Owner
Home Financials are based on the most recent Mortgage that was taken out on this home.Home Values in the Area
Average Home Value in this Area
Purchase History
We collect this data history from publicly available records. To have your information removed, we recommend requesting removal directly through your county’s website.
| Date | Buyer | Sale Price | Title Company |
|---|---|---|---|
| $212,000 | -- |
Mortgage History
We collect this data history from publicly available records. To have your information removed, we recommend requesting removal directly through your county’s website.
| Date | Status | Borrower | Loan Amount |
|---|---|---|---|
| Open | $191,300 | ||
| Closed | $206,625 |
Tax History
We collect this data history from publicly available records. To have your information removed, we recommend requesting removal directly through your county’s website.
| Year | Tax Paid | Tax Assessment Tax Assessment Total Assessment is a certain percentage of the fair market value that is determined by local assessors to be the total taxable value of land and additions on the property. | Land | Improvement |
|---|---|---|---|---|
| 2025 | $5,528 | $420,400 | $123,600 | $296,800 |
| 2024 | $5,188 | $420,400 | $123,600 | $296,800 |
| 2023 | $6,241 | $368,400 | $83,100 | $285,300 |
| 2022 | $6,108 | $368,400 | $83,100 | $285,300 |
| 2021 | $6,108 | $368,400 | $83,100 | $285,300 |
| 2020 | $5,837 | $279,400 | $68,700 | $210,700 |
| 2019 | $5,837 | $279,400 | $68,700 | $210,700 |
| 2018 | $5,624 | $279,400 | $68,700 | $210,700 |
| 2017 | $5,912 | $260,200 | $61,000 | $199,200 |
| 2016 | $5,696 | $260,200 | $61,000 | $199,200 |
| 2015 | $5,696 | $260,200 | $61,000 | $199,200 |
| 2014 | $5,846 | $253,500 | $58,200 | $195,300 |
Map
- 44 Burgess Ave
- 176 Fuller St
- 163 Liberty St
- 157 Liberty St
- 169 Liberty St
- 182 Fuller St
- 175 Liberty St
- 41 Burgess Ave
- 14 Empire St
- 4 Empire St
- 20 Empire St
- 151 Bloomfield St
- 145 Bloomfield St
- 33 Burgess Ave
- 155 Fuller St
- 152 Fuller St
- 139 Bloomfield St
- 155 Bloomfield St
- 57 Burgess Ave
- 149 Liberty St
Ask me questions while you tour the home.