170 Prospect St Hingham, MA 02043
South Hingham NeighborhoodEstimated Value: $1,581,525 - $1,869,000
About This Home
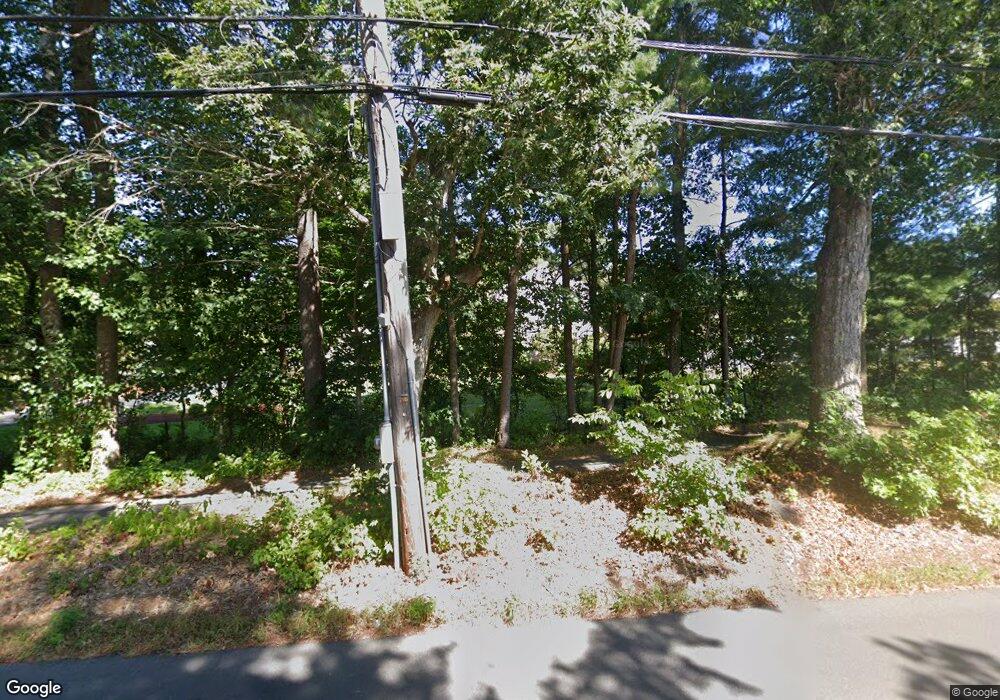
This home is located at 170 Prospect St, Hingham, MA 02043 and is currently estimated at $1,769,131, approximately $561 per square foot. 170 Prospect St is a home located in Plymouth County with nearby schools including South Elementary School, Hingham Middle School, and Hingham High School.
Ownership History
We collect this data history from publicly available records. To have your information removed, we recommend requesting removal directly through your county’s website.
Purchase Details
Purchase Details
Purchase Details
Home Values in the Area
Average Home Value in this Area
Purchase History
We collect this data history from publicly available records. To have your information removed, we recommend requesting removal directly through your county’s website.
| Date | Buyer | Sale Price | Title Company |
|---|---|---|---|
| -- | None Available | ||
| -- | -- | ||
| $24,300 | -- |
Mortgage History
We collect this data history from publicly available records. To have your information removed, we recommend requesting removal directly through your county’s website.
| Date | Status | Borrower | Loan Amount |
|---|---|---|---|
| Previous Owner | $150,000 | ||
| Previous Owner | $125,000 | ||
| Previous Owner | $110,000 |
Tax History
We collect this data history from publicly available records. To have your information removed, we recommend requesting removal directly through your county’s website.
| Year | Tax Paid | Tax Assessment Tax Assessment Total Assessment is a certain percentage of the fair market value that is determined by local assessors to be the total taxable value of land and additions on the property. | Land | Improvement |
|---|---|---|---|---|
| 2025 | $13,834 | $1,294,100 | $509,800 | $784,300 |
| 2024 | $13,335 | $1,229,000 | $509,800 | $719,200 |
| 2023 | $11,480 | $1,148,000 | $509,800 | $638,200 |
| 2022 | $10,305 | $891,400 | $392,100 | $499,300 |
| 2021 | $10,024 | $849,500 | $392,100 | $457,400 |
| 2020 | $10,234 | $887,600 | $445,600 | $442,000 |
| 2019 | $10,164 | $860,600 | $445,600 | $415,000 |
| 2018 | $10,129 | $860,600 | $445,600 | $415,000 |
| 2017 | $9,622 | $785,500 | $444,800 | $340,700 |
| 2016 | $9,546 | $764,300 | $423,600 | $340,700 |
| 2015 | $9,321 | $743,900 | $403,200 | $340,700 |
Map
- 211 Charles St
- 172 Prospect St
- 160 Prospect St
- 209 Charles St
- 209 Charles St Unit 1
- 155 Prospect St
- 163 Prospect St
- 149 Prospect St
- 171 Prospect St
- 156 Prospect St
- 143 Prospect St
- 210 Charles St
- 184 Prospect St
- 179 Prospect St
- 183 Prospect St
- 206 Charles St
- 204 Charles St
- 185 Prospect St
- 137 Prospect St
- 1 Mast Hill Rd
Ask me questions while you tour the home.