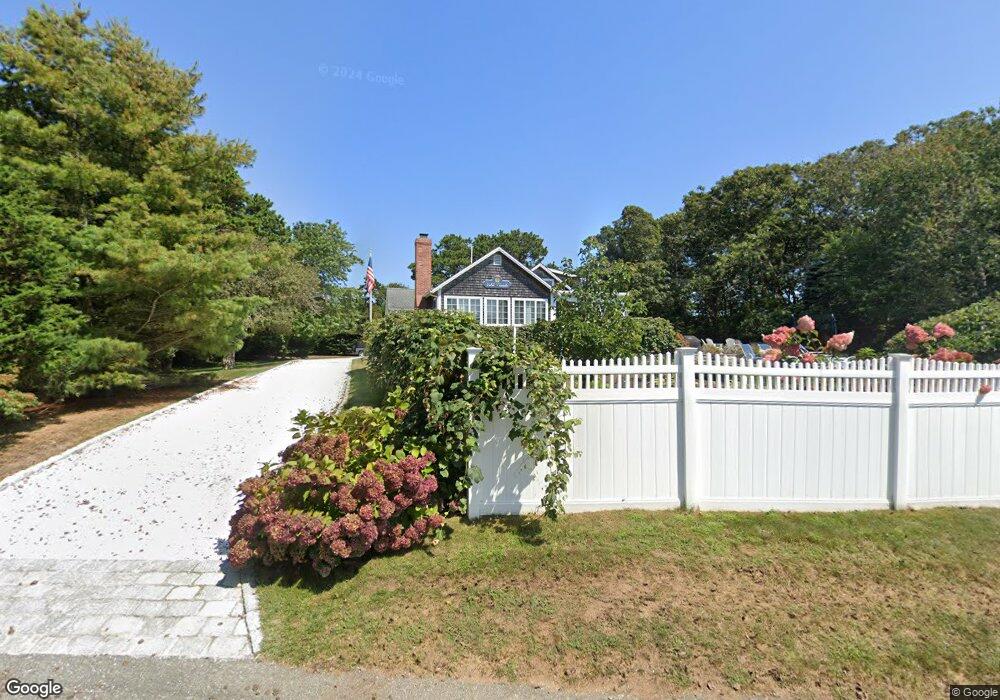
171 Cedar St Chatham, MA 02633
Chatham Village NeighborhoodEstimated Value: $2,555,853 - $2,929,000
About This Home
This home is located at 171 Cedar St, Chatham, MA 02633 and is currently estimated at $2,690,713, approximately $1,878 per square foot. 171 Cedar St is a home located in Barnstable County with nearby schools including Chatham Elementary School, Harwich Elementary School, and Monomoy Regional Middle School.
Ownership History
We collect this data history from publicly available records. To have your information removed, we recommend requesting removal directly through your county’s website.
Purchase Details
Home Financials for this Owner
Home Financials are based on the most recent Mortgage that was taken out on this home.Home Values in the Area
Average Home Value in this Area
Purchase History
We collect this data history from publicly available records. To have your information removed, we recommend requesting removal directly through your county’s website.
| Date | Buyer | Sale Price | Title Company |
|---|---|---|---|
| $792,500 | -- |
Mortgage History
We collect this data history from publicly available records. To have your information removed, we recommend requesting removal directly through your county’s website.
| Date | Status | Borrower | Loan Amount |
|---|---|---|---|
| Open | $600,000 |
Tax History
We collect this data history from publicly available records. To have your information removed, we recommend requesting removal directly through your county’s website.
| Year | Tax Paid | Tax Assessment Tax Assessment Total Assessment is a certain percentage of the fair market value that is determined by local assessors to be the total taxable value of land and additions on the property. | Land | Improvement |
|---|---|---|---|---|
| 2025 | $7,603 | $2,191,200 | $1,382,800 | $808,400 |
| 2024 | $7,388 | $2,069,600 | $1,304,600 | $765,000 |
| 2023 | $6,926 | $1,785,100 | $1,087,100 | $698,000 |
| 2022 | $7,323 | $1,585,100 | $1,087,100 | $498,000 |
| 2021 | $6,864 | $1,378,400 | $922,200 | $456,200 |
| 2020 | $6,084 | $1,262,300 | $843,100 | $419,200 |
| 2019 | $5,773 | $1,190,400 | $788,300 | $402,100 |
| 2018 | $5,622 | $1,154,400 | $788,300 | $366,100 |
| 2017 | $5,323 | $1,058,200 | $765,200 | $293,000 |
| 2016 | $5,117 | $1,019,400 | $750,200 | $269,200 |
| 2015 | $4,941 | $990,100 | $728,900 | $261,200 |
| 2014 | $5,027 | $989,600 | $728,900 | $260,700 |
Map
- 287 Cedar St
- 85 Cedar St
- 15 Windy Hill Way
- 157 Bridge St
- 42 Champlain Rd
- 99 Uncle Alberts Drive Extension
- 60 Harbor Hill Rd
- 727 Main St
- 66 Snow Ln
- 70 Judges Way
- 425 Main St Unit D
- 33 Crowell Rd
- 346 Morris Island Rd
- 99 Depot Rd Unit 23
- 912 Main St Unit 308
- 335 Stage Island Rd
- 7 Squanto Dr
- 15 Bay Ln
- 336 Stage Island Rd
- 1068 Main St Unit 1068
Ask me questions while you tour the home.