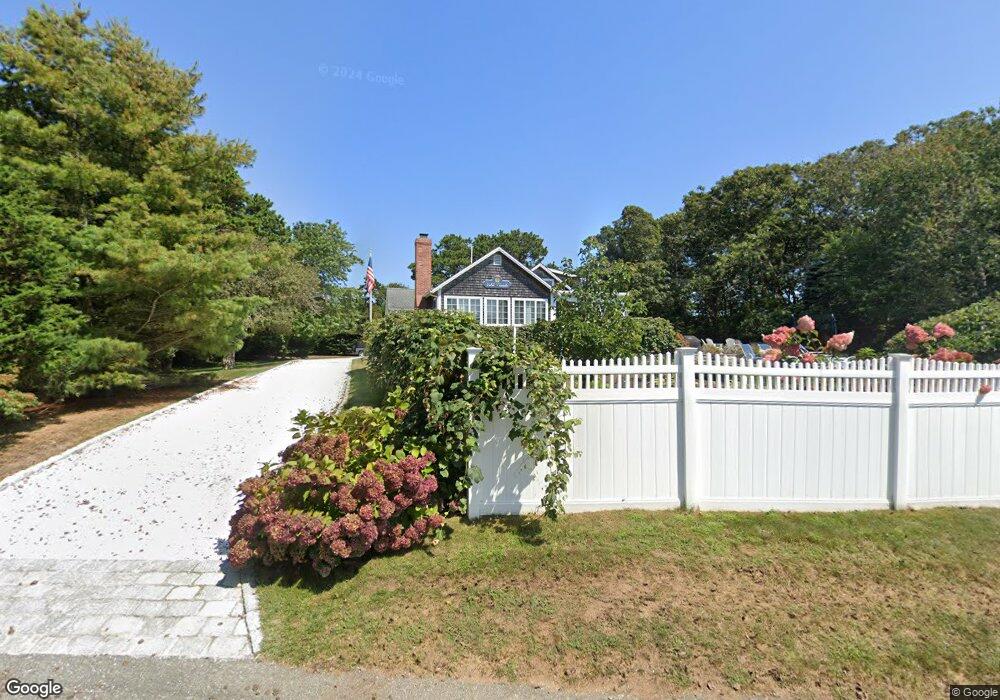
171 Cedar St Chatham, MA 02633
Chatham Village NeighborhoodEstimated Value: $2,136,000 - $3,416,000
4
Beds
2
Baths
1,432
Sq Ft
$1,894/Sq Ft
Est. Value
About This Home
This home is located at 171 Cedar St, Chatham, MA 02633 and is currently estimated at $2,712,120, approximately $1,893 per square foot. 171 Cedar St is a home located in Barnstable County with nearby schools including Chatham Elementary School, Harwich Elementary School, and Monomoy Regional Middle School.
Ownership History
Date
Name
Owned For
Owner Type
Purchase Details
Closed on
Feb 23, 2007
Sold by
Mckenna John D and Mckenna Phyllis J
Bought by
May 3Rd Herbert G and May Teddi M
Current Estimated Value
Home Financials for this Owner
Home Financials are based on the most recent Mortgage that was taken out on this home.
Original Mortgage
$600,000
Outstanding Balance
$360,771
Interest Rate
6.23%
Mortgage Type
Purchase Money Mortgage
Estimated Equity
$2,351,349
Create a Home Valuation Report for This Property
The Home Valuation Report is an in-depth analysis detailing your home's value as well as a comparison with similar homes in the area
Home Values in the Area
Average Home Value in this Area
Purchase History
| Date | Buyer | Sale Price | Title Company |
|---|---|---|---|
| May 3Rd Herbert G | $792,500 | -- |
Source: Public Records
Mortgage History
| Date | Status | Borrower | Loan Amount |
|---|---|---|---|
| Open | May 3Rd Herbert G | $600,000 |
Source: Public Records
Tax History
| Year | Tax Paid | Tax Assessment Tax Assessment Total Assessment is a certain percentage of the fair market value that is determined by local assessors to be the total taxable value of land and additions on the property. | Land | Improvement |
|---|---|---|---|---|
| 2025 | $7,603 | $2,191,200 | $1,382,800 | $808,400 |
| 2024 | $7,388 | $2,069,600 | $1,304,600 | $765,000 |
| 2023 | $6,926 | $1,785,100 | $1,087,100 | $698,000 |
| 2022 | $7,323 | $1,585,100 | $1,087,100 | $498,000 |
| 2021 | $6,864 | $1,378,400 | $922,200 | $456,200 |
| 2020 | $6,084 | $1,262,300 | $843,100 | $419,200 |
| 2019 | $5,773 | $1,190,400 | $788,300 | $402,100 |
| 2018 | $5,622 | $1,154,400 | $788,300 | $366,100 |
| 2017 | $5,323 | $1,058,200 | $765,200 | $293,000 |
| 2016 | $5,117 | $1,019,400 | $750,200 | $269,200 |
| 2015 | $4,941 | $990,100 | $728,900 | $261,200 |
| 2014 | $5,027 | $989,600 | $728,900 | $260,700 |
Source: Public Records
Map
Nearby Homes
- 287 Cedar St
- 85 Cedar St
- 15 Windy Hill Way
- 99 Uncle Alberts Drive Extension
- 157 Bridge St
- 42 Champlain Rd
- 92 Absegami Run
- 60 Harbor Hill Rd
- 70 Judges Way
- 33 Crowell Rd
- 14 Pond View Ln
- 425 Main St Unit D
- 425 Main St Unit D
- 6 Munson Meeting Way
- 912 Main St Unit 308
- 346 Morris Island Rd
- 246 Stage Island Rd
- 50 Eldredge Square S
- 70 Old Queen Anne Rd
- 100 Heritage Ln
Your Personal Tour Guide
Ask me questions while you tour the home.