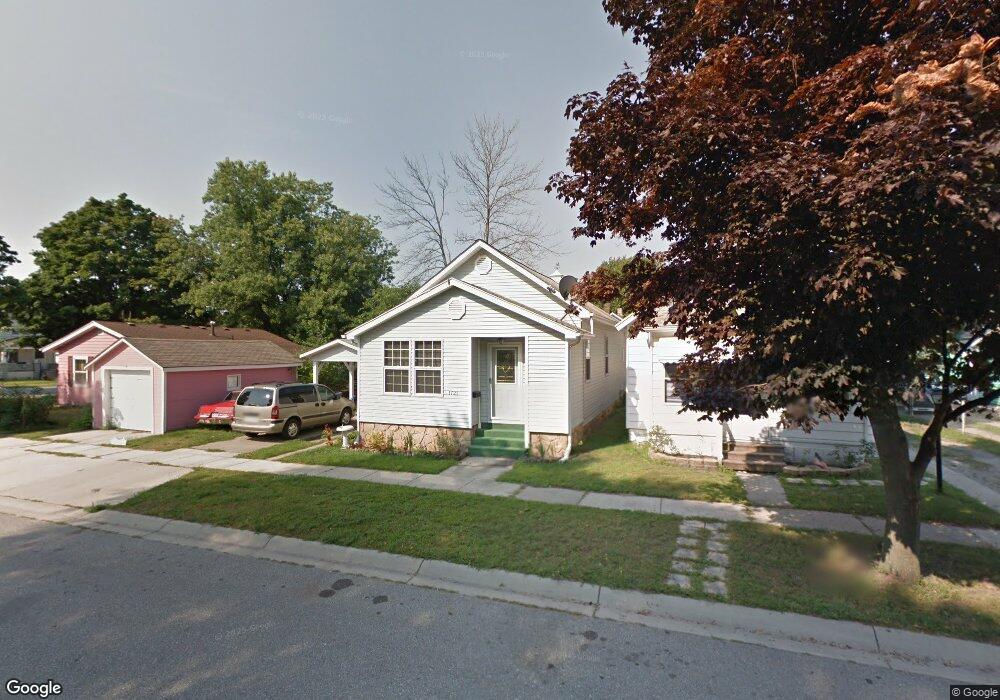
1721 Jay St Port Huron, MI 48060
Estimated Value: $103,000 - $137,000
3
Beds
1
Bath
952
Sq Ft
$127/Sq Ft
Est. Value
About This Home
This home is located at 1721 Jay St, Port Huron, MI 48060 and is currently estimated at $121,346, approximately $127 per square foot. 1721 Jay St is a home located in St. Clair County with nearby schools including Woodrow Wilson Elementary School, Central Middle School, and Port Huron High School.
Ownership History
Date
Name
Owned For
Owner Type
Purchase Details
Closed on
Jan 6, 2021
Sold by
Washe Andrew
Bought by
Surline Frederick J and Surline Stacy J
Current Estimated Value
Purchase Details
Closed on
Jan 21, 2011
Sold by
Washe Andrew
Bought by
Surline Frederick J and Surline Stacy J
Purchase Details
Closed on
Dec 10, 2009
Sold by
Herriman Scott A
Bought by
Deutsche Bank National Trust Company
Create a Home Valuation Report for This Property
The Home Valuation Report is an in-depth analysis detailing your home's value as well as a comparison with similar homes in the area
Home Values in the Area
Average Home Value in this Area
Purchase History
| Date | Buyer | Sale Price | Title Company |
|---|---|---|---|
| Surline Frederick J | $28,000 | Liberty Title | |
| Surline Frederick J | -- | Liberty Title | |
| Washe Andrew | $7,955 | None Available | |
| Deutsche Bank National Trust Company | $20,000 | None Available |
Source: Public Records
Tax History
| Year | Tax Paid | Tax Assessment Tax Assessment Total Assessment is a certain percentage of the fair market value that is determined by local assessors to be the total taxable value of land and additions on the property. | Land | Improvement |
|---|---|---|---|---|
| 2025 | $1,235 | $56,800 | $0 | $0 |
| 2024 | $1,203 | $54,900 | $0 | $0 |
| 2023 | $1,137 | $49,400 | $0 | $0 |
| 2022 | $1,144 | $44,400 | $0 | $0 |
| 2020 | $1,098 | $33,500 | $33,500 | $0 |
| 2019 | $1,079 | $23,700 | $0 | $0 |
| 2018 | $1,055 | $23,700 | $0 | $0 |
| 2017 | $943 | $22,300 | $0 | $0 |
| 2016 | $798 | $22,300 | $0 | $0 |
| 2015 | $835 | $22,200 | $22,200 | $0 |
| 2014 | $835 | $23,300 | $23,300 | $0 |
| 2013 | -- | $25,700 | $0 | $0 |
Source: Public Records
Map
Nearby Homes
Your Personal Tour Guide
Ask me questions while you tour the home.