Estimated Value: $447,000 - $463,000
4
Beds
3
Baths
1,382
Sq Ft
$329/Sq Ft
Est. Value
About This Home
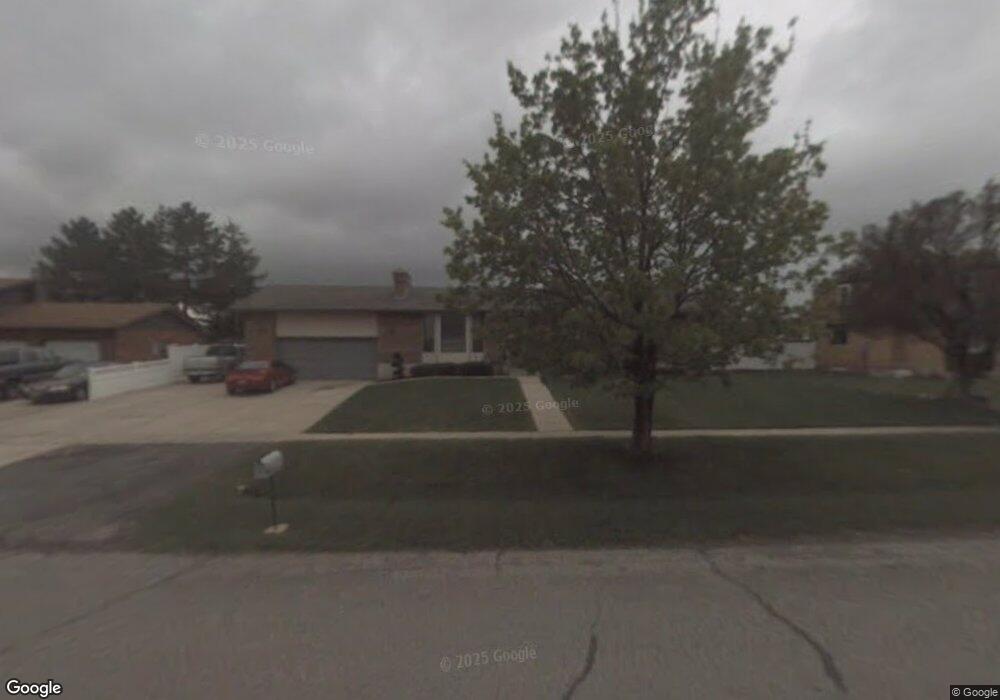
This home is located at 1723 W 4575 S, Roy, UT 84067 and is currently estimated at $454,316, approximately $328 per square foot. 1723 W 4575 S is a home located in Weber County with nearby schools including Valley View School, Sand Ridge Junior High School, and Roy High School.
Ownership History
Date
Name
Owned For
Owner Type
Purchase Details
Closed on
Jan 16, 2013
Sold by
Barnes Jeffrey M and Barnes Chase J
Bought by
Barnes Jeffrey M
Current Estimated Value
Create a Home Valuation Report for This Property
The Home Valuation Report is an in-depth analysis detailing your home's value as well as a comparison with similar homes in the area
Home Values in the Area
Average Home Value in this Area
Purchase History
| Date | Buyer | Sale Price | Title Company |
|---|---|---|---|
| Barnes Jeffrey M | -- | None Available |
Source: Public Records
Tax History
| Year | Tax Paid | Tax Assessment Tax Assessment Total Assessment is a certain percentage of the fair market value that is determined by local assessors to be the total taxable value of land and additions on the property. | Land | Improvement |
|---|---|---|---|---|
| 2025 | $2,928 | $469,660 | $155,000 | $314,660 |
| 2024 | $2,860 | $254,099 | $85,258 | $168,841 |
| 2023 | $2,762 | $245,850 | $82,387 | $163,463 |
| 2022 | $2,644 | $240,900 | $66,004 | $174,896 |
| 2021 | $2,288 | $344,000 | $85,012 | $258,988 |
| 2020 | $2,092 | $288,000 | $85,012 | $202,988 |
| 2019 | $2,093 | $272,000 | $49,940 | $222,060 |
| 2018 | $1,995 | $244,000 | $45,019 | $198,981 |
| 2017 | $1,847 | $211,000 | $45,019 | $165,981 |
| 2016 | $1,736 | $106,325 | $24,652 | $81,673 |
| 2015 | $1,601 | $100,218 | $21,944 | $78,274 |
| 2014 | $1,568 | $96,498 | $21,944 | $74,554 |
Source: Public Records
Map
Nearby Homes
- 4598 S Blossom Glen Way
- 4602 Hathaway Dr
- 1765 W 5000 S
- 2038 W 4600 S
- 1838 W 5050 S
- 1818 W 5050 S
- 2015 W 4450 S
- 1789 W 5050 S
- 1781 W 5050 S
- 5092 S 1800 W
- 1198 W 4400 S Unit V
- 1198 W 4400 S Unit T
- 2015 W 4225 S
- 4220 S 2075 W
- 1114 W 4650 S
- 5131 S 1275 W
- 5124 S 1275 W
- 5125 S 1250 W
- 1959 3985 St S Unit 2
- 4963 S 2275 W
- 1731 W 4575 S
- 4584 Wedgewood Dr
- 1658 Seneca Dr
- 1652 Seneca Dr
- 4588 Wedgewood Dr
- 1646 Seneca Dr
- 4583 Wedgewood Dr Unit 32
- 4572 S 1725 W
- 1640 Seneca Dr
- 1747 W 4575 S
- 4593 Promenade Dr
- 4593 Promenade Dr Unit 1654
- 1679 W 4575 S
- 4592 Wedgewood Dr
- 4571 S 1725 W
- 4587 Wedgewood Dr
- 1634 Seneca Dr
- 4595 Wedgewood Dr
- 4569 S 1675 W
- 1648 Royal Ridge Dr
Your Personal Tour Guide
Ask me questions while you tour the home.