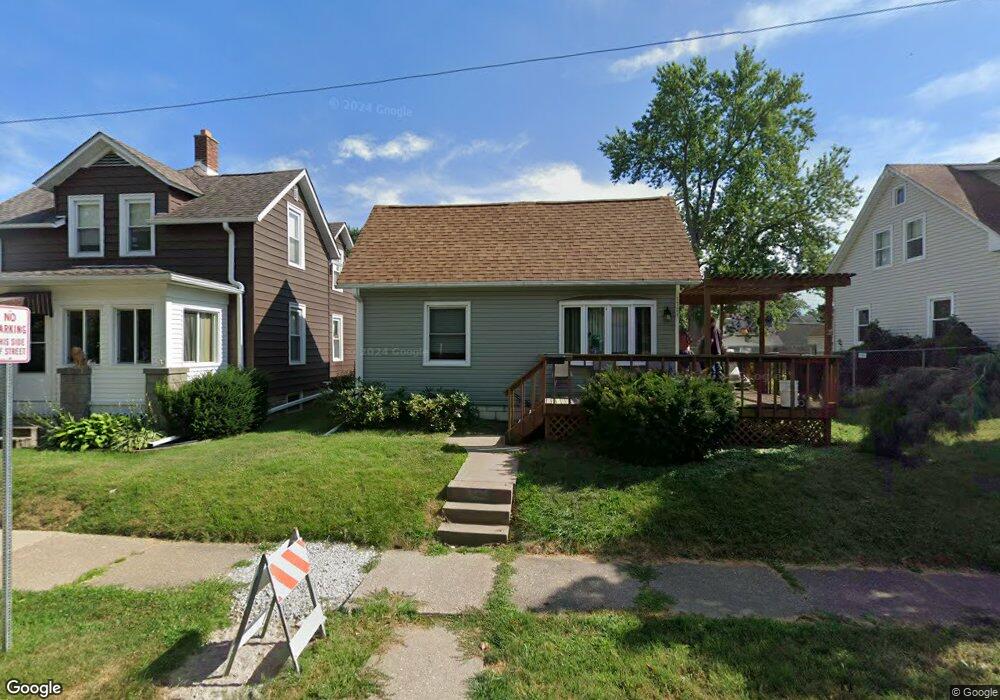
1724 16th Ave Moline, IL 61265
Willard-Wharton NeighborhoodEstimated Value: $84,826 - $114,000
2
Beds
1
Bath
912
Sq Ft
$114/Sq Ft
Est. Value
About This Home
This home is located at 1724 16th Ave, Moline, IL 61265 and is currently estimated at $103,707, approximately $113 per square foot. 1724 16th Ave is a home located in Rock Island County with nearby schools including Willard Elementary School, John Deere Middle School, and Moline Sr High School.
Ownership History
Date
Name
Owned For
Owner Type
Purchase Details
Closed on
Nov 23, 2020
Sold by
Selby Enterprises Llc
Bought by
Pink John and Turner Ilaria
Current Estimated Value
Home Financials for this Owner
Home Financials are based on the most recent Mortgage that was taken out on this home.
Original Mortgage
$711,291
Outstanding Balance
$573,937
Interest Rate
2.8%
Mortgage Type
Seller Take Back
Estimated Equity
-$470,230
Purchase Details
Closed on
Nov 1, 2017
Sold by
Thomas Dopler and Thomas Teresa
Bought by
Selby Enterprises Llc
Create a Home Valuation Report for This Property
The Home Valuation Report is an in-depth analysis detailing your home's value as well as a comparison with similar homes in the area
Home Values in the Area
Average Home Value in this Area
Purchase History
| Date | Buyer | Sale Price | Title Company |
|---|---|---|---|
| Pink John | $352,932 | Gomez Title | |
| Selby Enterprises Llc | $78,900 | William T Phares Pc |
Source: Public Records
Mortgage History
| Date | Status | Borrower | Loan Amount |
|---|---|---|---|
| Open | Pink John | $711,291 |
Source: Public Records
Tax History
| Year | Tax Paid | Tax Assessment Tax Assessment Total Assessment is a certain percentage of the fair market value that is determined by local assessors to be the total taxable value of land and additions on the property. | Land | Improvement |
|---|---|---|---|---|
| 2024 | $2,642 | $29,950 | $3,158 | $26,792 |
| 2023 | $2,642 | $28,633 | $3,019 | $25,614 |
| 2022 | $2,515 | $27,638 | $3,019 | $24,619 |
| 2021 | $2,506 | $26,397 | $2,883 | $23,514 |
| 2020 | $2,519 | $26,240 | $2,866 | $23,374 |
| 2019 | $2,419 | $25,625 | $2,799 | $22,826 |
| 2018 | $2,419 | $25,324 | $2,766 | $22,558 |
| 2017 | $2,365 | $24,803 | $2,709 | $22,094 |
| 2016 | $2,337 | $24,389 | $2,664 | $21,725 |
| 2015 | $2,288 | $23,887 | $2,609 | $21,278 |
| 2014 | $423 | $24,036 | $2,625 | $21,411 |
| 2013 | $423 | $24,036 | $2,625 | $21,411 |
Source: Public Records
Map
Nearby Homes
- 1306 17th St
- 1416 17th Ave
- 1546 12th Ave
- 1412 13th St
- 920 17th St Unit 28
- 930 17th St Unit 14
- 1212 14th Ave
- 940 17th St Unit 7
- 1125 17th Ave
- 2121 15th Street A
- 1841 Avenue of the Cities
- 2334 18th Ave
- 1115 14th St
- 2308 18th Ave
- 1169 23rd St
- 2320 18th Street A
- 736 14th St
- 2324 18th Street B
- 1186 24th St
- 1141 24th St
- 1730 16th Ave
- 1716 16th Ave
- 1712 16th Ave
- 1631 18th St
- 1631 18th St Unit C
- 1619 18th St Unit C
- 1617 18th St Unit C
- 1613 18th St Unit C
- 1611 18th St Unit C
- 1717 16th Ave
- 1710 16th Ave
- 1729 17th Ave
- 1721 17th Ave
- 1632 18th St Unit A
- 1713 16th Ave
- 1804 16th Ave
- 1620 18th St Unit B
- 1616 18th St
- 1616 18th St Unit B
- 1612 18th St Unit B
Your Personal Tour Guide
Ask me questions while you tour the home.