1725 Mckinley St Enumclaw, WA 98022
Estimated Value: $503,000 - $569,000
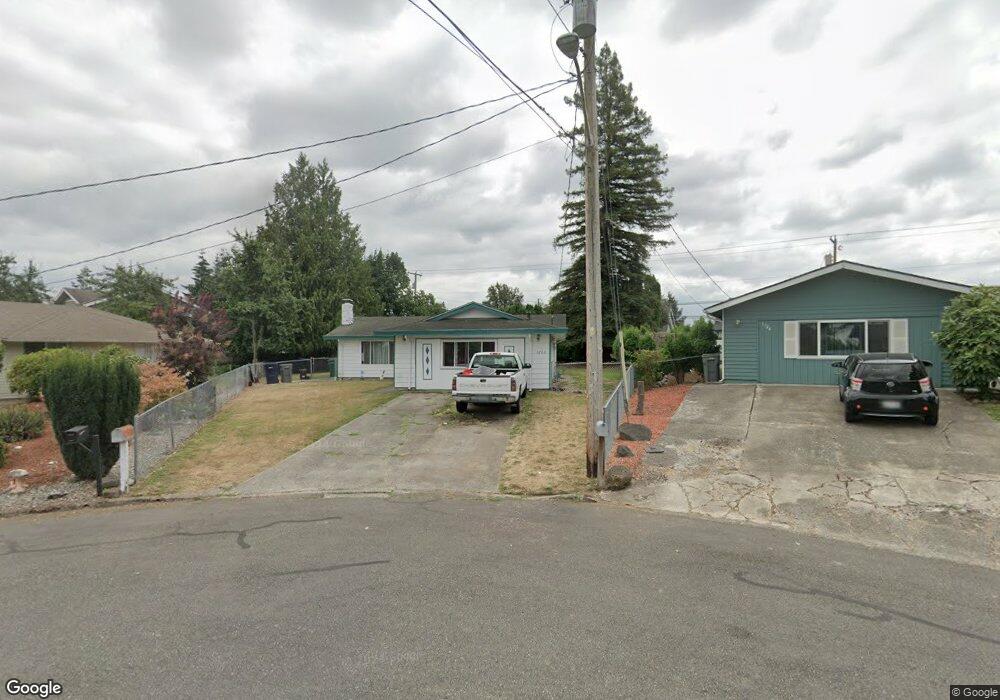
About This Home
This home is located at 1725 Mckinley St, Enumclaw, WA 98022 and is currently estimated at $535,106, approximately $347 per square foot. 1725 Mckinley St is a home located in King County with nearby schools including Byron Kibler Elementary School, Enumclaw Middle School, and Enumclaw Senior High School.
Ownership History
We collect this data history from publicly available records. To have your information removed, we recommend requesting removal directly through your county’s website.
Purchase Details
Home Financials for this Owner
Home Financials are based on the most recent Mortgage that was taken out on this home.Purchase Details
Home Financials for this Owner
Home Financials are based on the most recent Mortgage that was taken out on this home.Purchase Details
Purchase Details
Home Values in the Area
Average Home Value in this Area
Purchase History
We collect this data history from publicly available records. To have your information removed, we recommend requesting removal directly through your county’s website.
| Date | Buyer | Sale Price | Title Company |
|---|---|---|---|
| $313 | Nelson & Allen Ps | ||
| $135,000 | First American | ||
| $111,818 | Fidelity National Title | ||
| $111,818 | Fidelity National Title | ||
| $122,000 | -- |
Mortgage History
We collect this data history from publicly available records. To have your information removed, we recommend requesting removal directly through your county’s website.
| Date | Status | Borrower | Loan Amount |
|---|---|---|---|
| Open | $335,775 | ||
| Previous Owner | $140,625 |
Tax History
We collect this data history from publicly available records. To have your information removed, we recommend requesting removal directly through your county’s website.
| Year | Tax Paid | Tax Assessment Tax Assessment Total Assessment is a certain percentage of the fair market value that is determined by local assessors to be the total taxable value of land and additions on the property. | Land | Improvement |
|---|---|---|---|---|
| 2025 | $4,550 | $474,000 | $196,000 | $278,000 |
| 2024 | $4,311 | $449,000 | $177,000 | $272,000 |
| 2023 | $4,002 | $385,000 | $152,000 | $233,000 |
| 2022 | $3,584 | $440,000 | $174,000 | $266,000 |
| 2021 | $2,976 | $357,000 | $150,000 | $207,000 |
| 2020 | $2,713 | $270,000 | $104,000 | $166,000 |
| 2018 | $2,759 | $248,000 | $96,000 | $152,000 |
| 2017 | $2,448 | $225,000 | $88,000 | $137,000 |
| 2016 | $2,414 | $206,000 | $81,000 | $125,000 |
| 2015 | $2,282 | $200,000 | $77,000 | $123,000 |
| 2014 | -- | $181,000 | $83,000 | $98,000 |
| 2013 | -- | $156,000 | $67,000 | $89,000 |
Map
- 2707 Initial Place
- 1875 Loraine St
- 1428 Loraine St
- 2249 Griffin Ave
- 1904 Lafromboise St
- 2219 Kibler Ave
- 1156 Semanski St
- 1966 Wilson Ave
- 43810 244th Ave SE
- 3189 Roosevelt Ave
- 3522 Elmont Ave
- 3183 Roosevelt Ave
- 1059 Lafromboise St
- 1076 Lindenberger Ln
- 3584 Elmont Ave
- 2678 Terry Ct
- 843 Harmony Ln
- 2054 Roosevelt Ave
- 3015 Fredrickson St
- 2759 Christianson Ave
- 2641 Griffin Ave
- 1731 Mckinley St
- 1724 Mckinley St
- 1732 Florence St
- 1732 Florence St Unit +1734
- 1743 Mckinley St
- 2638 Griffin Ave
- 2638 Griffin Ave
- 2715 Griffin Ave
- 2648 Griffin Ave
- 2628R Griffin Ave
- 2628 Griffin Ave
- 1746 Florence St Unit &1748
- 1746 Florence St Unit 1 & 2
- 1746 Florence St
- 2722 Cascade Ave
- 0 xxx Florence St
- 2614 Griffin Ave
- 1759 Mckinley St
- 1760 Florence St
Ask me questions while you tour the home.