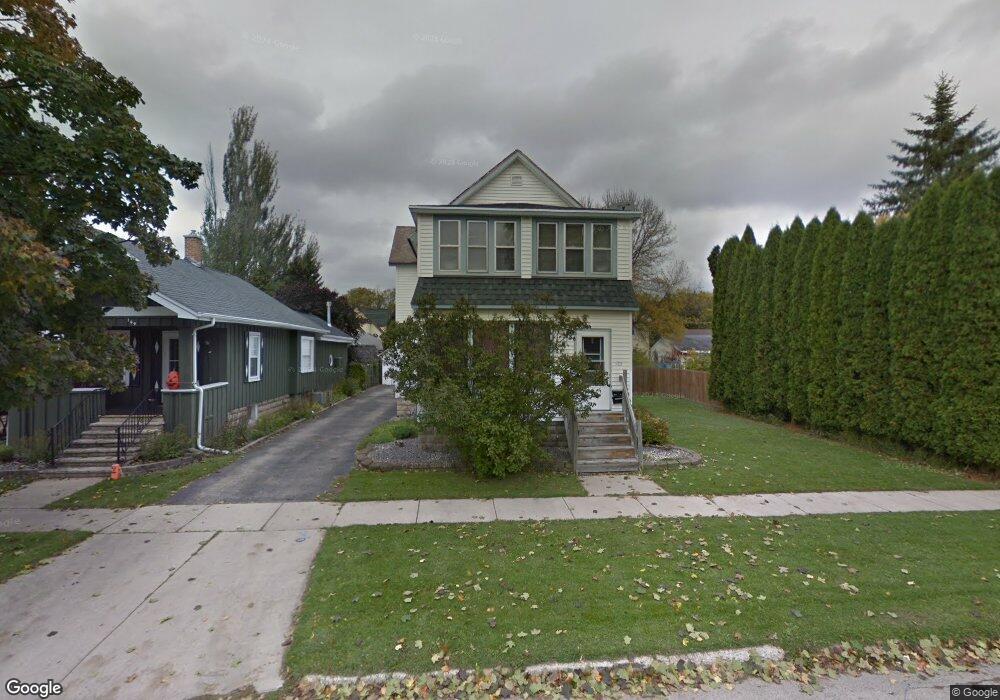
173 E 10th St Fond Du Lac, WI 54935
Estimated Value: $184,679 - $225,000
5
Beds
2
Baths
2,298
Sq Ft
$88/Sq Ft
Est. Value
About This Home
This home is located at 173 E 10th St, Fond Du Lac, WI 54935 and is currently estimated at $201,170, approximately $87 per square foot. 173 E 10th St is a home located in Fond du Lac County with nearby schools including Waters Elementary School, Theisen Middle School, and Fond du Lac High School.
Ownership History
Date
Name
Owned For
Owner Type
Purchase Details
Closed on
Aug 2, 2008
Sold by
Andrew Michael M
Bought by
Simmons Gene Ryan
Current Estimated Value
Home Financials for this Owner
Home Financials are based on the most recent Mortgage that was taken out on this home.
Original Mortgage
$11,500
Outstanding Balance
$5,396
Interest Rate
6.39%
Mortgage Type
Credit Line Revolving
Estimated Equity
$195,774
Create a Home Valuation Report for This Property
The Home Valuation Report is an in-depth analysis detailing your home's value as well as a comparison with similar homes in the area
Home Values in the Area
Average Home Value in this Area
Purchase History
| Date | Buyer | Sale Price | Title Company |
|---|---|---|---|
| Simmons Gene Ryan | $115,000 | None Available |
Source: Public Records
Mortgage History
| Date | Status | Borrower | Loan Amount |
|---|---|---|---|
| Open | Simmons Gene Ryan | $11,500 | |
| Open | Simmons Gene Ryan | $92,000 |
Source: Public Records
Tax History
| Year | Tax Paid | Tax Assessment Tax Assessment Total Assessment is a certain percentage of the fair market value that is determined by local assessors to be the total taxable value of land and additions on the property. | Land | Improvement |
|---|---|---|---|---|
| 2025 | $2,745 | $165,100 | $18,800 | $146,300 |
| 2024 | $2,528 | $103,600 | $17,000 | $86,600 |
| 2023 | $2,432 | $103,600 | $17,000 | $86,600 |
| 2022 | $2,321 | $103,600 | $17,000 | $86,600 |
| 2021 | $2,794 | $103,600 | $17,000 | $86,600 |
| 2020 | $2,353 | $103,600 | $17,000 | $86,600 |
| 2019 | $2,520 | $103,600 | $17,000 | $86,600 |
| 2018 | $2,650 | $98,100 | $17,000 | $81,100 |
| 2017 | $2,370 | $98,100 | $17,000 | $81,100 |
| 2016 | $2,365 | $98,100 | $17,000 | $81,100 |
| 2015 | $2,397 | $98,100 | $17,000 | $81,100 |
| 2014 | -- | $98,100 | $17,000 | $81,100 |
| 2013 | $2,714 | $113,500 | $18,900 | $94,600 |
Source: Public Records
Map
Nearby Homes
Your Personal Tour Guide
Ask me questions while you tour the home.