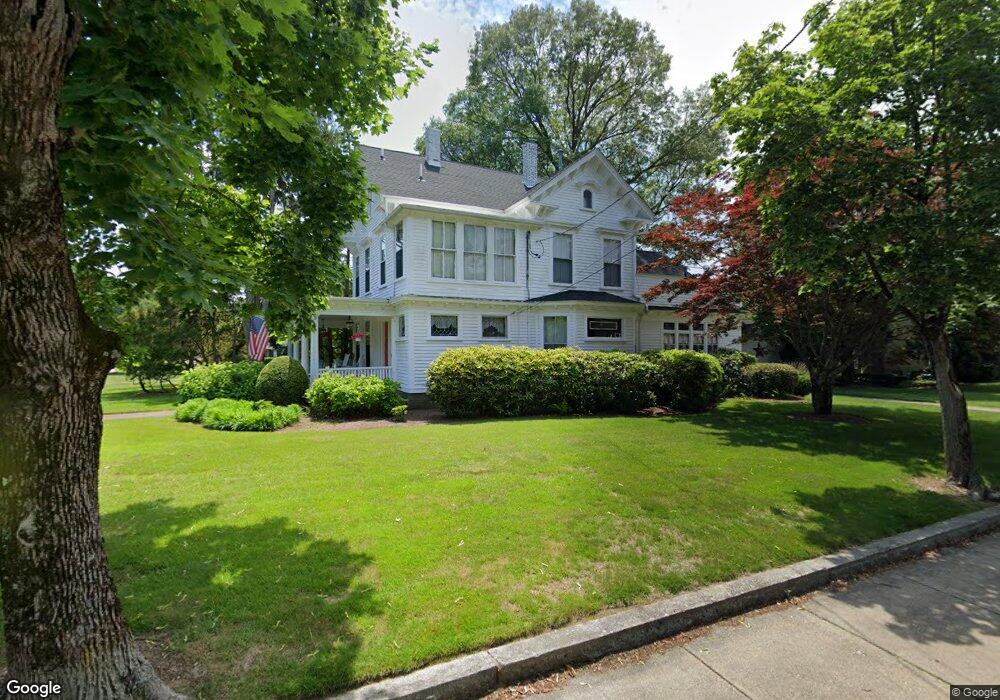
173 S Main St Mansfield, MA 02048
Estimated Value: $713,000 - $1,003,000
4
Beds
3
Baths
3,345
Sq Ft
$264/Sq Ft
Est. Value
About This Home
This home is located at 173 S Main St, Mansfield, MA 02048 and is currently estimated at $881,984, approximately $263 per square foot. 173 S Main St is a home located in Bristol County with nearby schools including Everett W. Robinson Elementary School, Jordan/Jackson Elementary School, and Harold L. Qualters Middle School.
Ownership History
Date
Name
Owned For
Owner Type
Purchase Details
Closed on
Apr 29, 1994
Sold by
Marcheselli Chris
Bought by
Mckenna James M and Mckenna Elaine G
Current Estimated Value
Purchase Details
Closed on
Nov 30, 1993
Sold by
Durmis Julius J and Durmis Julia A
Bought by
Marcheseli Christopher
Purchase Details
Closed on
Aug 26, 1993
Sold by
Durmis Julius J and Durmis Julia A
Bought by
Mccarthy Paul E and Mccarthy Marianne
Create a Home Valuation Report for This Property
The Home Valuation Report is an in-depth analysis detailing your home's value as well as a comparison with similar homes in the area
Home Values in the Area
Average Home Value in this Area
Purchase History
We collect this data history from publicly available records. To have your information removed, we recommend requesting removal directly through your county’s website.
| Date | Buyer | Sale Price | Title Company |
|---|---|---|---|
| Mckenna James M | $159,360 | -- | |
| Marcheseli Christopher | $63,000 | -- | |
| Mccarthy Paul E | $246,000 | -- |
Source: Public Records
Mortgage History
We collect this data history from publicly available records. To have your information removed, we recommend requesting removal directly through your county’s website.
| Date | Status | Borrower | Loan Amount |
|---|---|---|---|
| Open | Mccarthy Paul E | $50,000 | |
| Open | Mccarthy Paul E | $215,000 |
Source: Public Records
Tax History
| Year | Tax Paid | Tax Assessment Tax Assessment Total Assessment is a certain percentage of the fair market value that is determined by local assessors to be the total taxable value of land and additions on the property. | Land | Improvement |
|---|---|---|---|---|
| 2025 | $10,180 | $773,000 | $244,700 | $528,300 |
| 2024 | $9,967 | $738,300 | $244,700 | $493,600 |
| 2023 | $9,498 | $674,100 | $244,700 | $429,400 |
| 2022 | $9,339 | $615,600 | $226,600 | $389,000 |
| 2021 | $5,957 | $561,000 | $198,300 | $362,700 |
| 2020 | $7,768 | $505,700 | $188,900 | $316,800 |
| 2019 | $7,822 | $513,900 | $157,300 | $356,600 |
| 2018 | $5,509 | $491,300 | $150,000 | $341,300 |
| 2017 | $7,225 | $481,000 | $145,800 | $335,200 |
| 2016 | $6,787 | $440,400 | $138,800 | $301,600 |
| 2015 | $6,446 | $415,900 | $138,800 | $277,100 |
Source: Public Records
Map
Nearby Homes
Your Personal Tour Guide
Ask me questions while you tour the home.