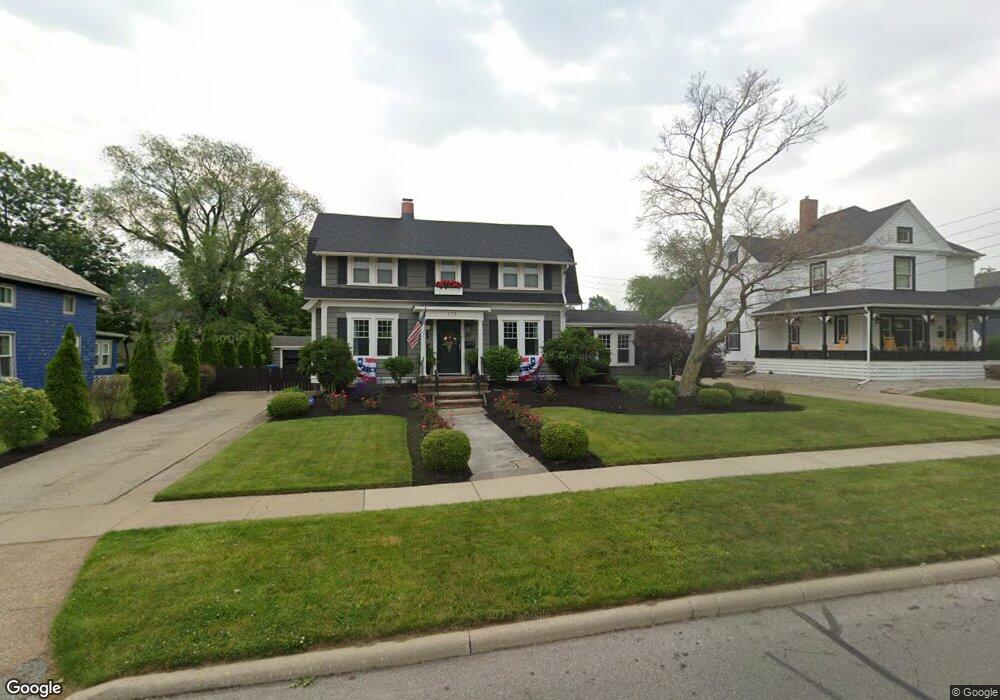
173 Spring St Amherst, OH 44001
Estimated Value: $226,942 - $245,000
About This Home
This home is located at 173 Spring St, Amherst, OH 44001 and is currently estimated at $237,486, approximately $134 per square foot. 173 Spring St is a home located in Lorain County with nearby schools including Powers Elementary School, Walter G. Nord Middle School, and Amherst Junior High School.
Ownership History
We collect this data history from publicly available records. To have your information removed, we recommend requesting removal directly through your county’s website.
Purchase Details
Purchase Details
Home Financials for this Owner
Home Financials are based on the most recent Mortgage that was taken out on this home.Home Values in the Area
Average Home Value in this Area
Purchase History
We collect this data history from publicly available records. To have your information removed, we recommend requesting removal directly through your county’s website.
| Date | Buyer | Sale Price | Title Company |
|---|---|---|---|
| -- | None Listed On Document | ||
| $165,000 | Sandstone Title Agency Ltd |
Mortgage History
We collect this data history from publicly available records. To have your information removed, we recommend requesting removal directly through your county’s website.
| Date | Status | Borrower | Loan Amount |
|---|---|---|---|
| Previous Owner | $162,450 |
Tax History
We collect this data history from publicly available records. To have your information removed, we recommend requesting removal directly through your county’s website.
| Year | Tax Paid | Tax Assessment Tax Assessment Total Assessment is a certain percentage of the fair market value that is determined by local assessors to be the total taxable value of land and additions on the property. | Land | Improvement |
|---|---|---|---|---|
| 2024 | $2,741 | $66,255 | $13,419 | $52,836 |
| 2023 | $2,823 | $53,743 | $12,569 | $41,174 |
| 2022 | $2,653 | $53,743 | $12,569 | $41,174 |
| 2021 | $2,660 | $53,743 | $12,569 | $41,174 |
| 2020 | $2,550 | $45,580 | $10,660 | $34,920 |
| 2019 | $2,502 | $45,580 | $10,660 | $34,920 |
| 2018 | $2,329 | $45,580 | $10,660 | $34,920 |
| 2017 | $2,347 | $43,110 | $9,040 | $34,070 |
| 2016 | $2,366 | $43,110 | $9,040 | $34,070 |
| 2015 | $2,353 | $43,110 | $9,040 | $34,070 |
| 2014 | $2,168 | $39,550 | $8,290 | $31,260 |
| 2013 | $2,176 | $39,550 | $8,290 | $31,260 |
Map
- 188 Jackson St
- 156 Beaver Ct
- 133 Crownhill Ave
- 151 Woodhill Dr
- 588 Jackson St
- 1031 Park Ave
- 320 Broadway St
- 267 Milan Ave
- 481 Shupe Ave
- 173 Terra Ln
- 672 Jackson St
- 107 Keswick Ct
- 310 N Woodhill Dr
- 880 Shadow Creek Trail
- 411 Stonebridge Dr
- 183 Sunrise Dr
- 578 N Main St
- 709 Oakhurst Dr
- 224 Sleepy Hollow Dr
- V/L Middle Ridge Rd
Ask me questions while you tour the home.