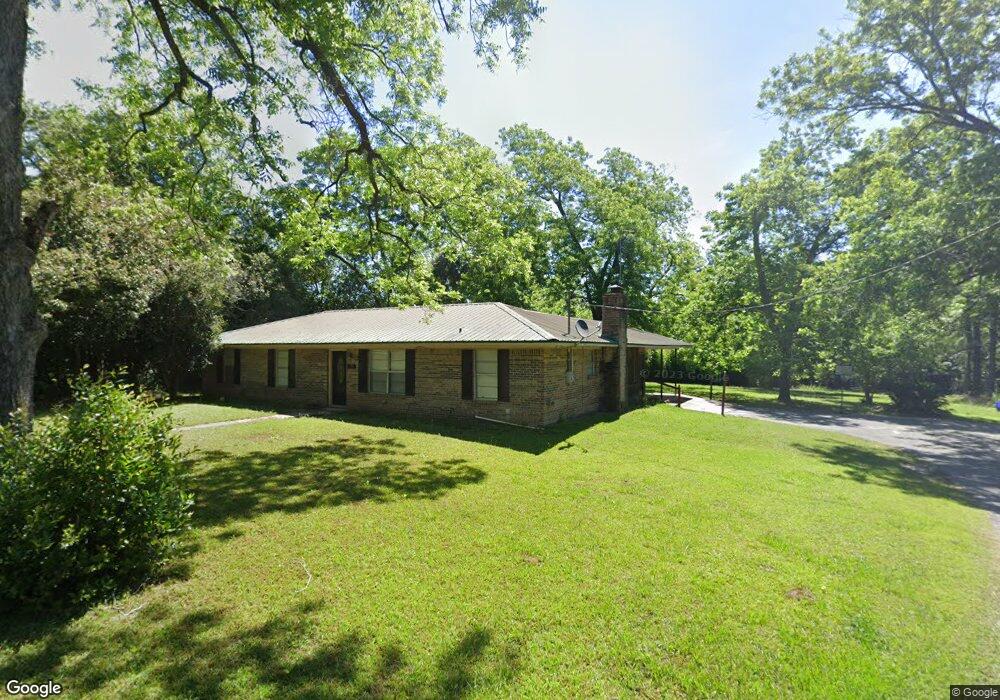
174 Larkin St Whigham, GA 39897
Estimated Value: $154,369 - $239,000
3
Beds
2
Baths
1,605
Sq Ft
$127/Sq Ft
Est. Value
About This Home
This home is located at 174 Larkin St, Whigham, GA 39897 and is currently estimated at $203,592, approximately $126 per square foot. 174 Larkin St is a home located in Grady County.
Ownership History
Date
Name
Owned For
Owner Type
Purchase Details
Closed on
Feb 1, 1993
Bought by
Clark Robert L
Current Estimated Value
Create a Home Valuation Report for This Property
The Home Valuation Report is an in-depth analysis detailing your home's value as well as a comparison with similar homes in the area
Purchase History
| Date | Buyer | Sale Price | Title Company |
|---|---|---|---|
| Clark Robert L | -- | -- |
Source: Public Records
Tax History
| Year | Tax Paid | Tax Assessment Tax Assessment Total Assessment is a certain percentage of the fair market value that is determined by local assessors to be the total taxable value of land and additions on the property. | Land | Improvement |
|---|---|---|---|---|
| 2025 | $1,684 | $60,714 | $1,840 | $58,874 |
| 2024 | $1,684 | $54,714 | $1,840 | $52,874 |
| 2023 | $1,406 | $38,513 | $1,640 | $36,873 |
| 2022 | $1,406 | $38,513 | $1,640 | $36,873 |
| 2021 | $1,412 | $38,513 | $1,640 | $36,873 |
| 2020 | $1,417 | $38,513 | $1,640 | $36,873 |
| 2019 | $1,417 | $38,513 | $1,640 | $36,873 |
| 2018 | $1,343 | $38,513 | $1,640 | $36,873 |
| 2017 | $1,290 | $38,513 | $1,640 | $36,873 |
| 2016 | $1,120 | $32,835 | $1,640 | $31,195 |
| 2015 | $1,053 | $32,835 | $1,640 | $31,195 |
| 2014 | -- | $32,835 | $1,640 | $31,195 |
| 2013 | -- | $29,722 | $1,640 | $28,082 |
Source: Public Records
Map
Nearby Homes
- 206 Lodge Ln
- 0 Jowers Rd
- 302 Nottingham Dr NW
- 384 Cleon Waldrop Rd
- 267 Providence Rd
- 491&501 Melton Brinson Rd
- 274 Barrineau Rd
- Jowers Rd
- 248 Due South Dr
- 269 Due South Dr
- 219 Lady Bug Ln
- 1718 Old 179 S
- 0 Upper Hawthorne Trail
- 1137 Summerfield
- 1520 Upper Hawthorne Trail
- 3695 Tired Creek Rd
- 00 Tired Creek Rd
- 00 Lake Douglas
- Lot 27 W Lake Dr
- 1808 Upper Hawthorne Trail
Your Personal Tour Guide
Ask me questions while you tour the home.