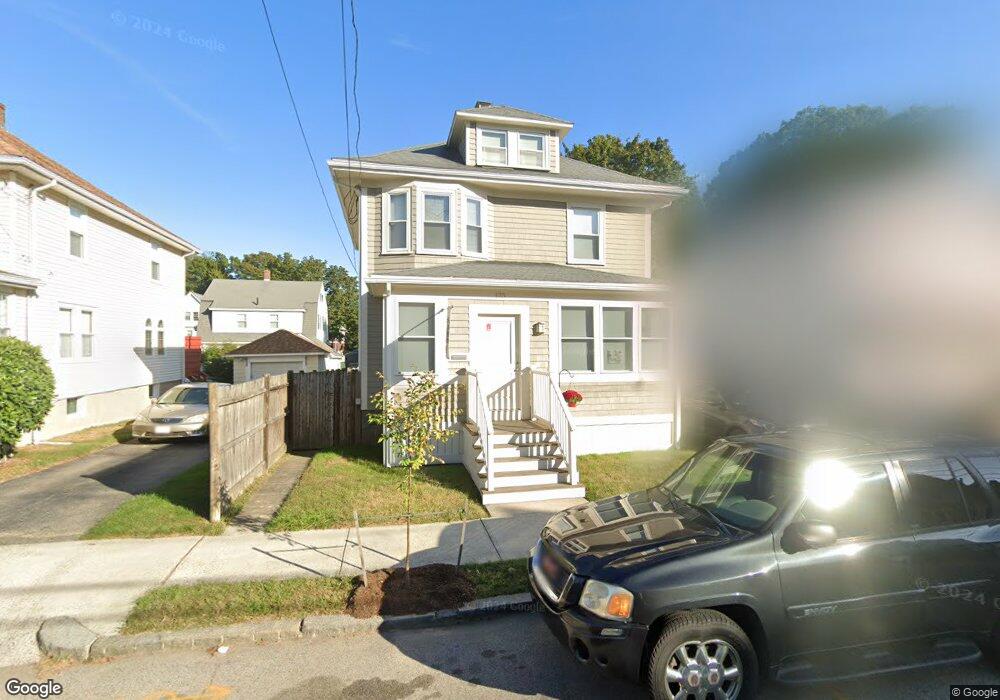
175 Beach St Quincy, MA 02170
Wollaston NeighborhoodEstimated Value: $557,000 - $795,000
About This Home
This home is located at 175 Beach St, Quincy, MA 02170 and is currently estimated at $679,916, approximately $481 per square foot. 175 Beach St is a home located in Norfolk County with nearby schools including Beechwood Knoll Elementary School, Atlantic Middle School, and North Quincy High School.
Ownership History
We collect this data history from publicly available records. To have your information removed, we recommend requesting removal directly through your county’s website.
Purchase Details
Home Financials for this Owner
Home Financials are based on the most recent Mortgage that was taken out on this home.Home Values in the Area
Average Home Value in this Area
Purchase History
We collect this data history from publicly available records. To have your information removed, we recommend requesting removal directly through your county’s website.
| Date | Buyer | Sale Price | Title Company |
|---|---|---|---|
| $141,900 | -- |
Mortgage History
We collect this data history from publicly available records. To have your information removed, we recommend requesting removal directly through your county’s website.
| Date | Status | Borrower | Loan Amount |
|---|---|---|---|
| Closed | $148,000 | ||
| Closed | $50,000 | ||
| Closed | $50,000 | ||
| Closed | $24,000 | ||
| Closed | $161,068 |
Tax History
We collect this data history from publicly available records. To have your information removed, we recommend requesting removal directly through your county’s website.
| Year | Tax Paid | Tax Assessment Tax Assessment Total Assessment is a certain percentage of the fair market value that is determined by local assessors to be the total taxable value of land and additions on the property. | Land | Improvement |
|---|---|---|---|---|
| 2025 | $7,410 | $642,700 | $319,000 | $323,700 |
| 2024 | $7,162 | $635,500 | $319,000 | $316,500 |
| 2023 | $6,657 | $598,100 | $303,800 | $294,300 |
| 2022 | $6,183 | $516,100 | $243,000 | $273,100 |
| 2021 | $6,143 | $506,000 | $243,000 | $263,000 |
| 2020 | $6,022 | $484,500 | $243,000 | $241,500 |
| 2019 | $5,738 | $457,200 | $227,100 | $230,100 |
| 2018 | $5,591 | $419,100 | $206,500 | $212,600 |
| 2017 | $5,498 | $388,000 | $206,500 | $181,500 |
| 2016 | $5,134 | $357,500 | $187,700 | $169,800 |
| 2015 | $4,754 | $325,600 | $170,600 | $155,000 |
| 2014 | $4,532 | $305,000 | $162,500 | $142,500 |
Map
- 174 Beach St
- 113 Elm Ave
- 99 Phillips St
- 153 Vassall St
- 41 Buckingham Rd
- 24 Rawson Rd
- 35 Sewall St
- 46 Warwick St
- 54 Marshall St
- 851 Quincy Shore Dr
- 13 Wentworth Rd Unit 303
- 9 Chick St
- 120 Holmes St Unit 304
- 115 Fenno St
- 245 Newport Ave
- 251 Newport Ave
- 260 Newbury Ave
- 67 Colby Rd
- 210 Newbury Ave Unit 2L
- 267-269 Farrington St
- 22 Bromfield St
- 26 Bromfield St
- 16 Bromfield St
- 161 Beach St
- 157 Beach St
- 165 Beach St
- 30 Bromfield St
- 153 Beach St
- 17 Bromfield St
- 169 Beach St
- 10 Bromfield St
- 25 Bromfield St
- 0000 Bromfield
- 151 Beach St
- 15 Bromfield St
- 36 Bromfield St
- 29 Bromfield St
- 6 Bromfield St
- 6 Bromfield St Unit 2
- 145 Beach St Unit 1
Ask me questions while you tour the home.