175 Fuller St Middleboro, MA 02346
Middleborough AreaEstimated Value: $560,000 - $612,000
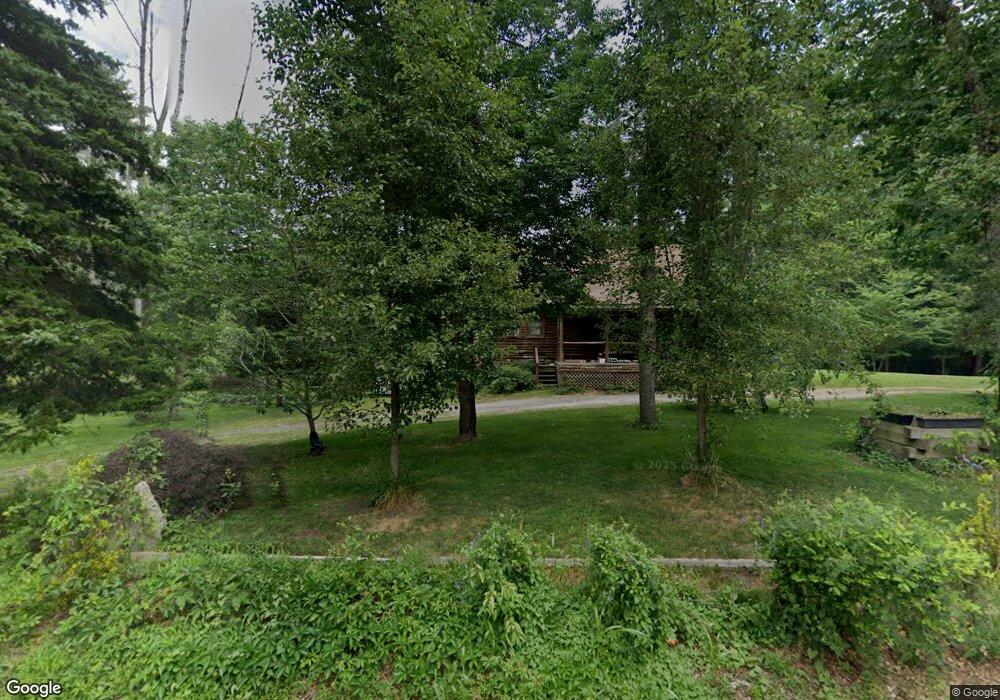
About This Home
This home is located at 175 Fuller St, Middleboro, MA 02346 and is currently estimated at $583,841, approximately $389 per square foot. 175 Fuller St is a home located in Plymouth County with nearby schools including Mary K. Goode Elementary School.
Ownership History
We collect this data history from publicly available records. To have your information removed, we recommend requesting removal directly through your county’s website.
Purchase Details
Purchase Details
Purchase Details
Home Values in the Area
Average Home Value in this Area
Purchase History
We collect this data history from publicly available records. To have your information removed, we recommend requesting removal directly through your county’s website.
| Date | Buyer | Sale Price | Title Company |
|---|---|---|---|
| -- | None Available | ||
| $40,000 | -- | ||
| $162,900 | -- |
Mortgage History
We collect this data history from publicly available records. To have your information removed, we recommend requesting removal directly through your county’s website.
| Date | Status | Borrower | Loan Amount |
|---|---|---|---|
| Previous Owner | $30,000 | ||
| Previous Owner | $85,000 | ||
| Previous Owner | $30,000 | ||
| Previous Owner | $85,000 | ||
| Previous Owner | $47,000 |
Tax History
We collect this data history from publicly available records. To have your information removed, we recommend requesting removal directly through your county’s website.
| Year | Tax Paid | Tax Assessment Tax Assessment Total Assessment is a certain percentage of the fair market value that is determined by local assessors to be the total taxable value of land and additions on the property. | Land | Improvement |
|---|---|---|---|---|
| 2025 | $6,010 | $448,200 | $188,500 | $259,700 |
| 2024 | $5,809 | $429,000 | $180,500 | $248,500 |
| 2023 | $5,675 | $398,500 | $180,500 | $218,000 |
| 2022 | $5,308 | $345,100 | $158,900 | $186,200 |
| 2021 | $5,280 | $324,500 | $141,600 | $182,900 |
| 2020 | $4,955 | $312,000 | $141,600 | $170,400 |
| 2019 | $4,542 | $293,400 | $141,600 | $151,800 |
| 2018 | $4,750 | $304,500 | $144,300 | $160,200 |
| 2017 | $4,673 | $296,300 | $139,700 | $156,600 |
| 2016 | $4,380 | $275,100 | $133,700 | $141,400 |
| 2015 | $4,289 | $271,800 | $133,700 | $138,100 |
Map
- 137 Cedar St
- 155 Plympton St
- 143 Plympton St
- 5 Brook St
- 3 Lydon Ln Unit A1
- 49 Thompson St
- 15 Prospect Rd
- 10 Amanda St
- 812 Plymouth St
- 25 Thomas Blanchard Dr
- 110 Center St
- 67 Franklin St
- 73 Franklin St
- 325 River St
- 73 Center St
- 76 Center St Unit A
- 76 Center St Unit B
- 899 Plymouth St
- 31 Parsonage Rd
- 49 Plain St
Ask me questions while you tour the home.