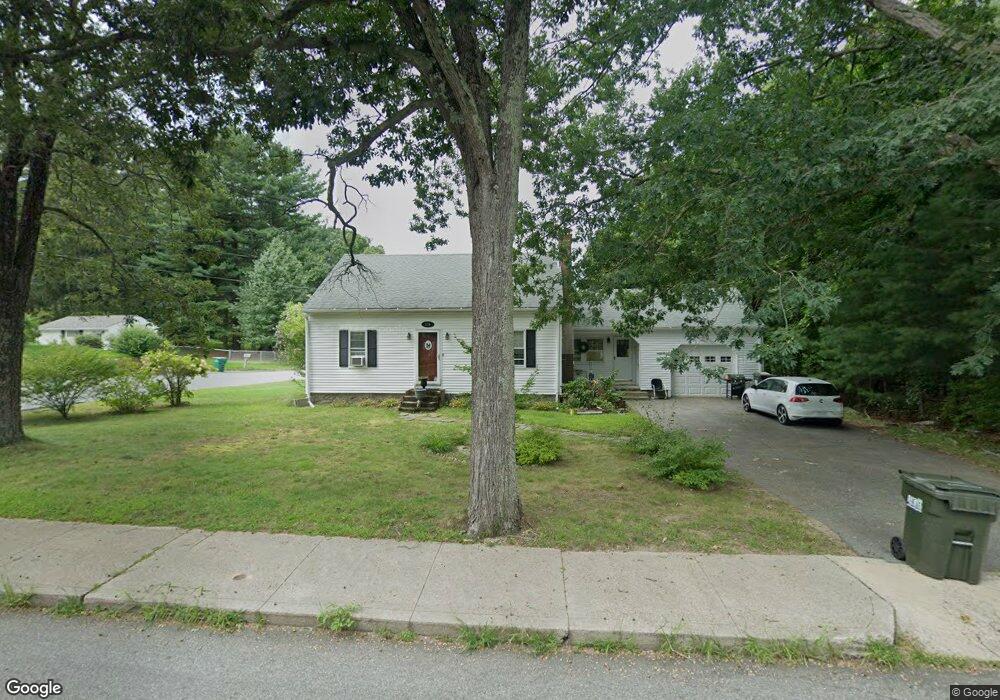
175 High St Uxbridge, MA 01569
Estimated Value: $407,000 - $462,000
3
Beds
1
Bath
1,248
Sq Ft
$343/Sq Ft
Est. Value
About This Home
This home is located at 175 High St, Uxbridge, MA 01569 and is currently estimated at $428,588, approximately $343 per square foot. 175 High St is a home located in Worcester County with nearby schools including Uxbridge High School and Our Lady of the Valley Regional School.
Ownership History
Date
Name
Owned For
Owner Type
Purchase Details
Closed on
Jan 8, 2002
Sold by
Est Taft Viriginia and Mackinnon Mildred D
Bought by
Hall Peter N and Hall Tracy L
Current Estimated Value
Home Financials for this Owner
Home Financials are based on the most recent Mortgage that was taken out on this home.
Original Mortgage
$104,000
Outstanding Balance
$41,531
Interest Rate
6.72%
Mortgage Type
Purchase Money Mortgage
Estimated Equity
$387,057
Create a Home Valuation Report for This Property
The Home Valuation Report is an in-depth analysis detailing your home's value as well as a comparison with similar homes in the area
Home Values in the Area
Average Home Value in this Area
Purchase History
We collect this data history from publicly available records. To have your information removed, we recommend requesting removal directly through your county’s website.
| Date | Buyer | Sale Price | Title Company |
|---|---|---|---|
| Hall Peter N | $130,000 | -- |
Source: Public Records
Mortgage History
We collect this data history from publicly available records. To have your information removed, we recommend requesting removal directly through your county’s website.
| Date | Status | Borrower | Loan Amount |
|---|---|---|---|
| Open | Hall Peter N | $104,000 |
Source: Public Records
Tax History
| Year | Tax Paid | Tax Assessment Tax Assessment Total Assessment is a certain percentage of the fair market value that is determined by local assessors to be the total taxable value of land and additions on the property. | Land | Improvement |
|---|---|---|---|---|
| 2025 | $44 | $333,300 | $128,700 | $204,600 |
| 2024 | $4,044 | $313,000 | $118,000 | $195,000 |
| 2023 | $3,910 | $280,300 | $107,200 | $173,100 |
| 2022 | $3,802 | $250,800 | $97,200 | $153,600 |
| 2021 | $3,805 | $240,500 | $92,900 | $147,600 |
| 2020 | $3,899 | $232,900 | $96,500 | $136,400 |
| 2019 | $3,781 | $217,900 | $89,400 | $128,500 |
| 2018 | $3,494 | $203,500 | $89,400 | $114,100 |
| 2017 | $3,212 | $189,400 | $78,000 | $111,400 |
| 2016 | $3,038 | $172,900 | $70,400 | $102,500 |
| 2015 | $2,977 | $171,100 | $70,400 | $100,700 |
Source: Public Records
Map
Nearby Homes
- 5 Peter St Unit D
- 2 Loyalist Dr Unit 2
- 24 Road Ahr
- 61 Spring Hill Dr Unit 61
- 11 Marion St
- 28 Cross Rd
- 152 S Main St
- 21 Crownshield Ave
- 20 Crownshield Ave
- 8 Tea Party Dr
- 16 Crownshield Ave Unit 16B
- 117 Quaker Hwy Unit 32
- 150 Hazel St
- 93 Mantell Rd
- 56 Nature View Dr
- 117 Saint Andre Dr
- 12 Pinecrest Rd Unit B
- 11 Boston St
- 3 Strathmore Shire Unit E
- 10 Wilson Dr
Your Personal Tour Guide
Ask me questions while you tour the home.