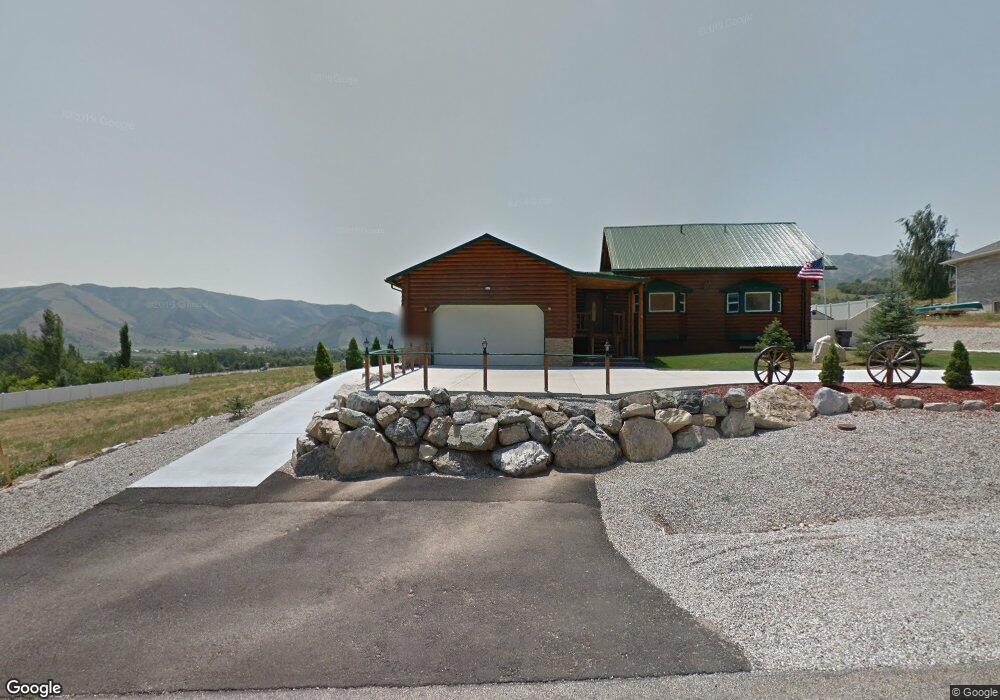
175 W 600 N Mantua, UT 84324
Estimated Value: $592,000 - $715,000
3
Beds
2
Baths
3,012
Sq Ft
$210/Sq Ft
Est. Value
About This Home
This home is located at 175 W 600 N, Mantua, UT 84324 and is currently estimated at $631,457, approximately $209 per square foot. 175 W 600 N is a home located in Box Elder County with nearby schools including Golden Spike Elementary, Box Elder Middle School, and Adele C. Young Intermediate School.
Ownership History
Date
Name
Owned For
Owner Type
Purchase Details
Closed on
Jan 22, 2009
Sold by
Acuff Jim and Abbott Rosemary
Bought by
Acuff Jim W and Acuff Rosemary S
Current Estimated Value
Home Financials for this Owner
Home Financials are based on the most recent Mortgage that was taken out on this home.
Original Mortgage
$275,793
Outstanding Balance
$173,951
Interest Rate
5.14%
Mortgage Type
FHA
Estimated Equity
$457,506
Create a Home Valuation Report for This Property
The Home Valuation Report is an in-depth analysis detailing your home's value as well as a comparison with similar homes in the area
Purchase History
| Date | Buyer | Sale Price | Title Company |
|---|---|---|---|
| Acuff Jim W | -- | -- |
Source: Public Records
Mortgage History
| Date | Status | Borrower | Loan Amount |
|---|---|---|---|
| Open | Acuff Jim W | $275,793 |
Source: Public Records
Tax History
| Year | Tax Paid | Tax Assessment Tax Assessment Total Assessment is a certain percentage of the fair market value that is determined by local assessors to be the total taxable value of land and additions on the property. | Land | Improvement |
|---|---|---|---|---|
| 2025 | $3,448 | $577,202 | $180,000 | $397,202 |
| 2024 | $3,106 | $579,878 | $175,000 | $404,878 |
| 2023 | $3,275 | $629,233 | $175,000 | $454,233 |
| 2022 | $3,472 | $330,755 | $49,500 | $281,255 |
| 2021 | $3,122 | $456,167 | $90,000 | $366,167 |
| 2020 | $3,175 | $456,167 | $90,000 | $366,167 |
| 2019 | $2,994 | $49,500 | $49,500 | $0 |
| 2018 | $2,046 | $147,384 | $46,038 | $101,346 |
| 2017 | $2,106 | $252,803 | $46,038 | $184,265 |
| 2016 | $2,095 | $142,558 | $27,500 | $115,058 |
| 2015 | $1,941 | $133,783 | $27,500 | $106,283 |
| 2014 | $1,941 | $129,605 | $27,500 | $102,105 |
| 2013 | -- | $129,605 | $19,250 | $110,355 |
Source: Public Records
Map
Nearby Homes
- 951 N Main St
- 214 W Center St
- 91 U S 89
- 67 E Center St
- 263 E Fish Hatchery Rd
- 534 E Fish Hatchery Rd
- 1623 Willard Peak Rd Unit 1
- 1705 Willard Peak Rd Unit 2
- 64 N Bywater Way
- 1228 Sheri Cir
- 1066 Beecher Ave
- 780 E 100 S Unit 1
- 800 E 100 S Unit 1
- 770 E 350 S
- 624 S 900 E
- 904 Sunset Dr
- 734 Fairview Dr
- 690 Sunset Dr
- 258 N 500 E
- 637 E 950 S Unit 20
Your Personal Tour Guide
Ask me questions while you tour the home.