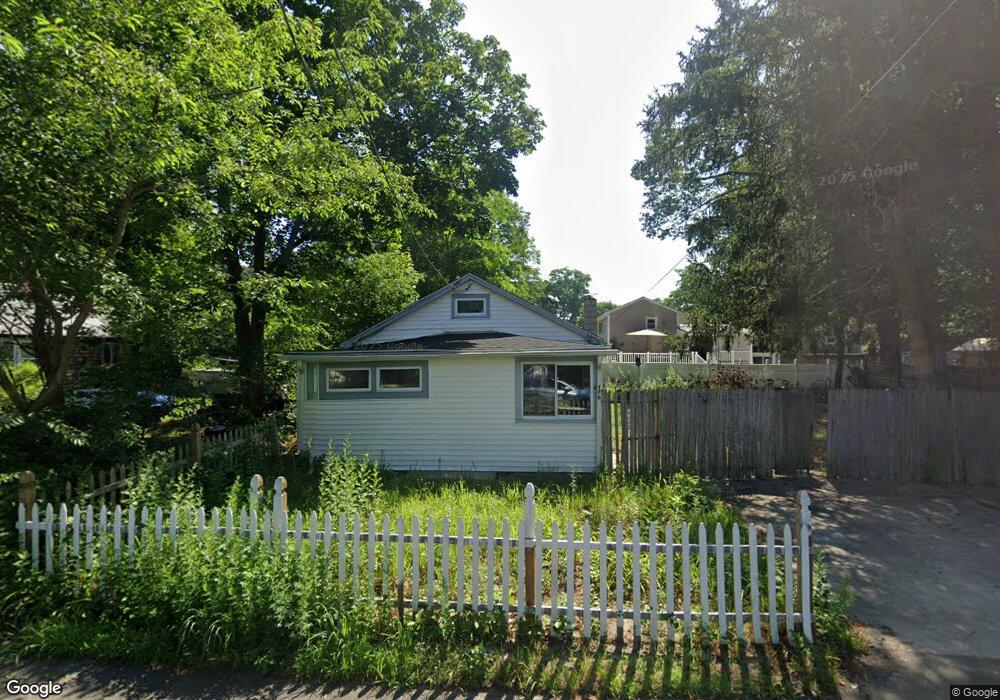
176 Canfield Ave Warwick, RI 02889
Buttonwoods NeighborhoodEstimated Value: $218,000 - $232,794
3
Beds
1
Bath
784
Sq Ft
$288/Sq Ft
Est. Value
About This Home
This home is located at 176 Canfield Ave, Warwick, RI 02889 and is currently estimated at $225,449, approximately $287 per square foot. 176 Canfield Ave is a home located in Kent County with nearby schools including St Rose Of Lima School, Saint Kevin School, and Bishop Hendricken High School.
Ownership History
Date
Name
Owned For
Owner Type
Purchase Details
Closed on
Aug 28, 2025
Sold by
Damico Lending Llc
Bought by
Jchv Group Llc
Current Estimated Value
Purchase Details
Closed on
Mar 27, 2024
Sold by
New England Hm Buyers Llc
Bought by
Cp Invest Llc
Home Financials for this Owner
Home Financials are based on the most recent Mortgage that was taken out on this home.
Original Mortgage
$250,000
Interest Rate
6.77%
Mortgage Type
Purchase Money Mortgage
Purchase Details
Closed on
Jul 19, 2018
Sold by
Bager James R and Bager Rose Lee
Bought by
Artanis Rigp
Create a Home Valuation Report for This Property
The Home Valuation Report is an in-depth analysis detailing your home's value as well as a comparison with similar homes in the area
Home Values in the Area
Average Home Value in this Area
Purchase History
We collect this data history from publicly available records. To have your information removed, we recommend requesting removal directly through your county’s website.
| Date | Buyer | Sale Price | Title Company |
|---|---|---|---|
| Jchv Group Llc | $175,000 | -- | |
| Cp Invest Llc | $175,000 | None Available | |
| Cp Invest Llc | $175,000 | None Available | |
| Artanis Rigp | $2,640 | -- | |
| Artanis Rigp | $2,640 | -- |
Source: Public Records
Mortgage History
We collect this data history from publicly available records. To have your information removed, we recommend requesting removal directly through your county’s website.
| Date | Status | Borrower | Loan Amount |
|---|---|---|---|
| Previous Owner | Cp Invest Llc | $250,000 |
Source: Public Records
Tax History
| Year | Tax Paid | Tax Assessment Tax Assessment Total Assessment is a certain percentage of the fair market value that is determined by local assessors to be the total taxable value of land and additions on the property. | Land | Improvement |
|---|---|---|---|---|
| 2025 | $3,500 | $275,600 | $101,600 | $174,000 |
| 2024 | $3,343 | $231,000 | $88,400 | $142,600 |
| 2023 | $3,278 | $231,000 | $88,400 | $142,600 |
| 2022 | $3,062 | $163,500 | $56,600 | $106,900 |
| 2021 | $3,062 | $163,500 | $56,600 | $106,900 |
| 2020 | $3,062 | $163,500 | $56,600 | $106,900 |
| 2019 | $3,062 | $163,500 | $56,600 | $106,900 |
| 2018 | $2,465 | $118,500 | $53,400 | $65,100 |
| 2017 | $2,398 | $118,500 | $53,400 | $65,100 |
| 2016 | $2,398 | $118,500 | $53,400 | $65,100 |
| 2015 | $2,226 | $107,300 | $55,400 | $51,900 |
| 2014 | $2,152 | $107,300 | $55,400 | $51,900 |
| 2013 | $2,123 | $107,300 | $55,400 | $51,900 |
Source: Public Records
Map
Nearby Homes
- 171 Canfield Ave
- 165 Canfield Ave
- 131 Canfield Ave
- 122 Gordon Ave
- 60 Tampa Ave
- 207 Glen Dr
- 48 Plenty St
- 78 Shand Ave
- 109 Pinegrove Ave
- 200 Glen Dr
- 79 Pinehurst Ave
- 188 Wood St
- 176 Horse Neck Rd
- 26 Limestone St
- 40 Northup St
- 0 Sea View Dr
- 19 Wood St Unit A
- 19 Wood St
- 213 Ottawa Ave
- 625 Oakland Beach Ave
- 179 Canfield Ave
- 198 Pettis Dr
- 206 Pettis Dr
- 185 Canfield Ave
- 163 Canfield Ave
- 190 Pettis Dr
- 168 Canfield Ave
- 188 Canfield Ave
- 224 Pettis Dr
- 182 Pettis Dr
- 158 Canfield Ave
- 175 Ryan Ave
- 155 Ryan Ave
- 195 Canfield Ave
- 145 Canfield Ave
- 174 Pettis Dr
- 149 Ryan Ave
- 241 Gordon Ave
- 197 Pettis Dr
- 189 Pettis Dr
Your Personal Tour Guide
Ask me questions while you tour the home.