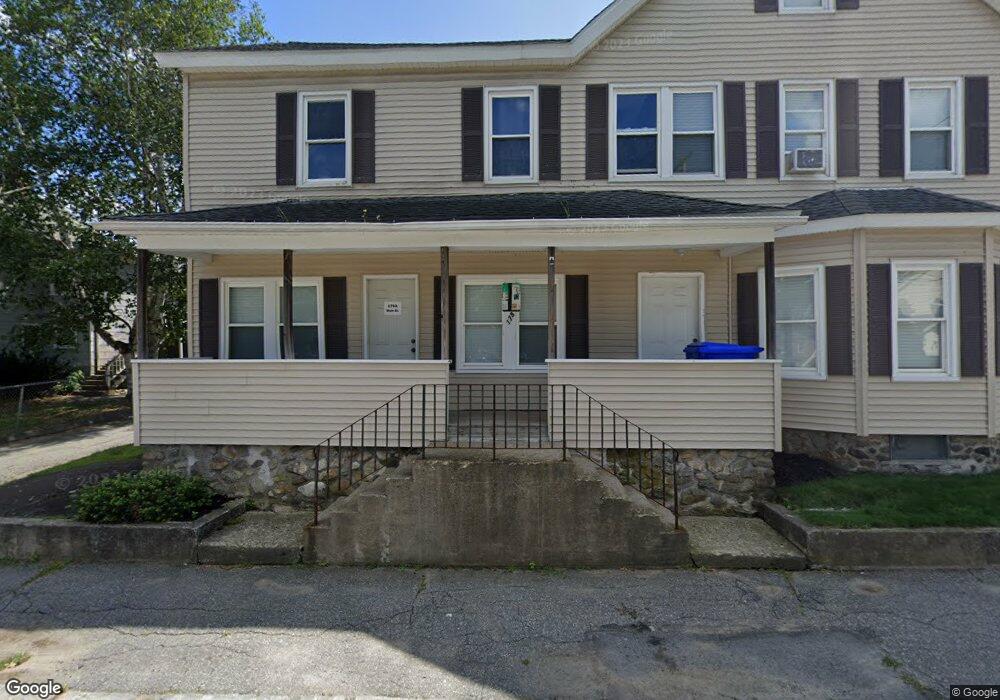
176 Main St Unit B Maynard, MA 01754
Estimated Value: $257,000 - $377,000
1
Bed
1
Bath
600
Sq Ft
$530/Sq Ft
Est. Value
About This Home
This home is located at 176 Main St Unit B, Maynard, MA 01754 and is currently estimated at $317,838, approximately $529 per square foot. 176 Main St Unit B is a home located in Middlesex County with nearby schools including Green Meadow School, Fowler School, and Maynard High School.
Ownership History
Date
Name
Owned For
Owner Type
Purchase Details
Closed on
May 16, 2001
Sold by
Kaufman Abraham and Kaufman Arlene R
Bought by
Hayes Timothy and Hayes Maureen B
Current Estimated Value
Home Financials for this Owner
Home Financials are based on the most recent Mortgage that was taken out on this home.
Original Mortgage
$79,050
Outstanding Balance
$29,517
Interest Rate
7.03%
Mortgage Type
Purchase Money Mortgage
Estimated Equity
$288,321
Create a Home Valuation Report for This Property
The Home Valuation Report is an in-depth analysis detailing your home's value as well as a comparison with similar homes in the area
Home Values in the Area
Average Home Value in this Area
Purchase History
We collect this data history from publicly available records. To have your information removed, we recommend requesting removal directly through your county’s website.
| Date | Buyer | Sale Price | Title Company |
|---|---|---|---|
| Hayes Timothy | $93,000 | -- |
Source: Public Records
Mortgage History
We collect this data history from publicly available records. To have your information removed, we recommend requesting removal directly through your county’s website.
| Date | Status | Borrower | Loan Amount |
|---|---|---|---|
| Open | Hayes Timothy | $79,050 | |
| Previous Owner | Hayes Timothy | $53,000 |
Source: Public Records
Tax History
| Year | Tax Paid | Tax Assessment Tax Assessment Total Assessment is a certain percentage of the fair market value that is determined by local assessors to be the total taxable value of land and additions on the property. | Land | Improvement |
|---|---|---|---|---|
| 2025 | $5,230 | $293,300 | $182,000 | $111,300 |
| 2024 | $4,820 | $269,600 | $173,300 | $96,300 |
| 2023 | $4,686 | $247,000 | $162,700 | $84,300 |
| 2022 | $4,295 | $209,300 | $141,500 | $67,800 |
| 2021 | $3,907 | $193,900 | $137,900 | $56,000 |
| 2020 | $3,930 | $190,400 | $134,400 | $56,000 |
| 2019 | $3,558 | $169,100 | $118,500 | $50,600 |
| 2018 | $3,235 | $142,900 | $104,000 | $38,900 |
| 2017 | $3,145 | $142,900 | $104,000 | $38,900 |
| 2016 | $3,037 | $142,900 | $104,000 | $38,900 |
| 2015 | $3,184 | $142,700 | $101,800 | $40,900 |
| 2014 | $3,080 | $138,200 | $97,300 | $40,900 |
Source: Public Records
Map
Nearby Homes
- 13 Riverbank Rd
- 10 Concord St
- 2 Dartmouth Ct Unit 2
- 1 Maple Unit 1
- 64 Parker St
- 2 Everett St
- 11 Sunset Rd
- 13 Arthur St Unit 15
- 22 Douglas Ave Unit 2
- 201 Summer St
- 62 Waltham St
- 70 Powder Mill Rd
- 11 Ethelyn Cir
- 4 Oak Ridge Dr Unit 6
- 166 Red Acre Rd
- 39 Adams St
- 34 Meeting House Ln Unit 207
- 34 Meeting House Ln Unit 321
- 34 Meeting House Ln Unit 114
- 34 Meeting House Ln Unit 317
- 176 1/2 Main St
- 178 Main St Unit 2R
- 178 Main St Unit 2L
- 178 Main St Unit 1
- 174 Main St
- 174 Main St Unit 2
- 174 Main St Unit 1R
- 3-5 Harriman Ct Unit 3A
- 3-5 Harriman Ct Unit D
- 35 Harriman Ct Unit D
- 35 Harriman Ct Unit C
- 35 Harriman Ct Unit B
- 35 Harriman Ct Unit A
- 3 Harriman Ct Unit 5
- 5 Harriman Ct Unit B
- 35 Harriman Ct Unit 3A
- 3-5 Harriman Ct
- 3 Harriman Ct Unit B
- 3A Harriman Ct Unit A
- 180 Main St
Your Personal Tour Guide
Ask me questions while you tour the home.