176 Main St Westford, MA 01886
Estimated Value: $725,104 - $773,000
About This Home
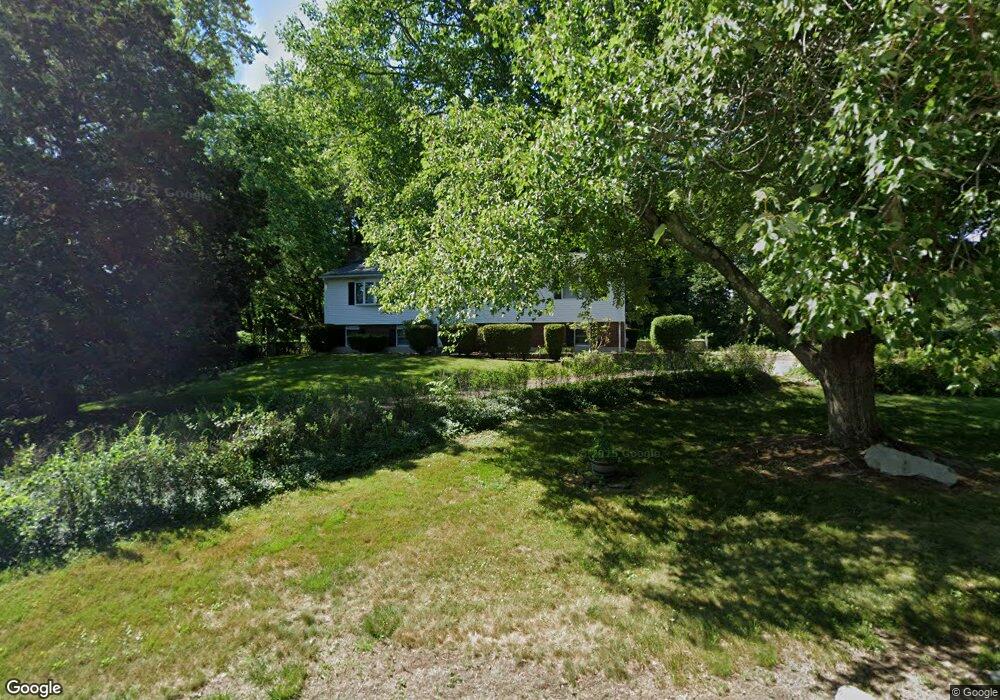
This home is located at 176 Main St, Westford, MA 01886 and is currently estimated at $748,776, approximately $556 per square foot. 176 Main St is a home located in Middlesex County with nearby schools including Nabnasset Elementary, Abbot Elementary School, and Stony Brook School.
Ownership History
We collect this data history from publicly available records. To have your information removed, we recommend requesting removal directly through your county’s website.
Purchase Details
Home Financials for this Owner
Home Financials are based on the most recent Mortgage that was taken out on this home.Home Values in the Area
Average Home Value in this Area
Purchase History
We collect this data history from publicly available records. To have your information removed, we recommend requesting removal directly through your county’s website.
| Date | Buyer | Sale Price | Title Company |
|---|---|---|---|
| $180,000 | -- |
Mortgage History
We collect this data history from publicly available records. To have your information removed, we recommend requesting removal directly through your county’s website.
| Date | Status | Borrower | Loan Amount |
|---|---|---|---|
| Closed | $130,000 |
Tax History
We collect this data history from publicly available records. To have your information removed, we recommend requesting removal directly through your county’s website.
| Year | Tax Paid | Tax Assessment Tax Assessment Total Assessment is a certain percentage of the fair market value that is determined by local assessors to be the total taxable value of land and additions on the property. | Land | Improvement |
|---|---|---|---|---|
| 2025 | $8,183 | $607,500 | $356,100 | $251,400 |
| 2024 | $7,966 | $578,500 | $339,100 | $239,400 |
| 2023 | $7,730 | $523,700 | $323,000 | $200,700 |
| 2022 | $7,744 | $480,400 | $286,000 | $194,400 |
| 2021 | $9,580 | $444,200 | $286,000 | $158,200 |
| 2020 | $7,282 | $445,900 | $286,000 | $159,900 |
| 2019 | $6,978 | $421,400 | $286,000 | $135,400 |
| 2018 | $9,975 | $411,500 | $276,100 | $135,400 |
| 2017 | $6,666 | $406,200 | $276,100 | $130,100 |
| 2016 | $6,439 | $395,000 | $263,800 | $131,200 |
| 2015 | $5,884 | $362,300 | $255,600 | $106,700 |
| 2014 | $5,833 | $351,400 | $245,600 | $105,800 |
Map
- 71 Chamberlain Rd
- 164 Main St Unit 2
- 2 Bartlett Rd
- 10 Baldwin Rd
- 19 Frances Hill Rd
- 8 Galloway Rd
- 14 Frances Hill Rd
- 14 Morning Glory Rd
- 124 Main St Unit 1
- 12 Brookside Rd Unit 25
- 261 Pine Hill Rd
- 10 Lucille Ave
- 17 Sherwood Dr
- 3 Jonathan Ln
- 9 Boxwood Rd
- 38 Brookside Rd
- 7 Providence Rd
- 1 Lawton Ave
- 12 Crabapple Ln
- 80 Providence Rd
- 178 Main St Unit 2
- 179 Main St
- 174 Main St
- 180 Main St
- 21 Swedes Crossing
- 182 Main St
- 69 Chamberlain Rd
- 2 Deer Run Dr
- 70 Chamberlain Rd Unit 1
- 70 Chamberlain Rd Unit 2
- 70 Chamberlain Rd Unit 1-2
- 4 Deer Run Dr
- 20 Swedes Crossing
- 19 Swedes Crossing
- 184 Main St
- 76 Chamberlain Rd
- 6 Deer Run Dr
- 181B Main St
- 181a Main St
- 181 Main St Unit A
Ask me questions while you tour the home.