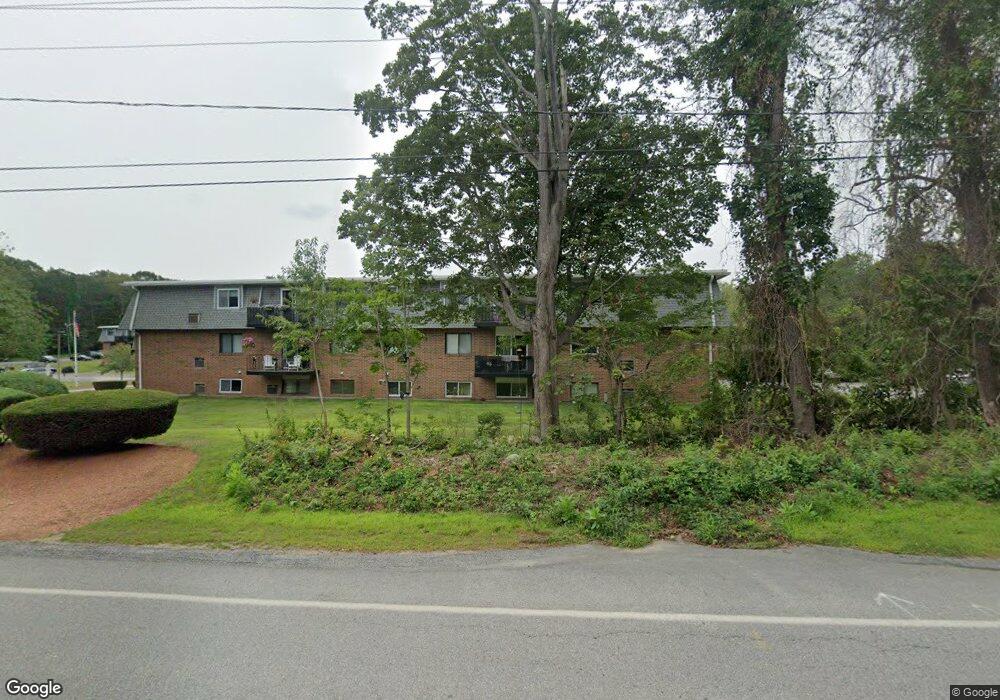
176 Maple Ave Unit 4-31 Rutland, MA 01543
Estimated Value: $159,000 - $197,000
2
Beds
1
Bath
793
Sq Ft
$231/Sq Ft
Est. Value
About This Home
This home is located at 176 Maple Ave Unit 4-31, Rutland, MA 01543 and is currently estimated at $183,498, approximately $231 per square foot. 176 Maple Ave Unit 4-31 is a home located in Worcester County with nearby schools including Wachusett Regional High School.
Ownership History
Date
Name
Owned For
Owner Type
Purchase Details
Closed on
Sep 6, 2019
Sold by
Livingston Timothy and Livingston Amy L
Bought by
Baker Pamela P
Current Estimated Value
Home Financials for this Owner
Home Financials are based on the most recent Mortgage that was taken out on this home.
Original Mortgage
$72,000
Outstanding Balance
$63,195
Interest Rate
3.7%
Mortgage Type
New Conventional
Estimated Equity
$120,303
Purchase Details
Closed on
Sep 6, 2016
Sold by
Sheard Anthony L and Orlans Moran Llc
Bought by
Us Bank Na Tr
Purchase Details
Closed on
Jul 13, 2007
Sold by
Countryside Rt and Reid
Bought by
Sheard Anthony L and Sheard Emilyann
Home Financials for this Owner
Home Financials are based on the most recent Mortgage that was taken out on this home.
Original Mortgage
$93,050
Interest Rate
6.48%
Mortgage Type
Purchase Money Mortgage
Create a Home Valuation Report for This Property
The Home Valuation Report is an in-depth analysis detailing your home's value as well as a comparison with similar homes in the area
Home Values in the Area
Average Home Value in this Area
Purchase History
| Date | Buyer | Sale Price | Title Company |
|---|---|---|---|
| Baker Pamela P | $90,000 | -- | |
| Us Bank Na Tr | $56,950 | -- | |
| Sheard Anthony L | $98,000 | -- |
Source: Public Records
Mortgage History
| Date | Status | Borrower | Loan Amount |
|---|---|---|---|
| Open | Baker Pamela P | $72,000 | |
| Previous Owner | Sheard Anthony L | $93,050 |
Source: Public Records
Tax History
| Year | Tax Paid | Tax Assessment Tax Assessment Total Assessment is a certain percentage of the fair market value that is determined by local assessors to be the total taxable value of land and additions on the property. | Land | Improvement |
|---|---|---|---|---|
| 2025 | $2,274 | $159,700 | $0 | $159,700 |
| 2024 | $1,851 | $124,800 | $0 | $124,800 |
| 2023 | $1,556 | $113,400 | $0 | $113,400 |
| 2022 | $1,508 | $95,500 | $0 | $95,500 |
| 2021 | $1,425 | $85,300 | $0 | $85,300 |
| 2020 | $1,599 | $90,800 | $0 | $90,800 |
| 2019 | $1,270 | $71,000 | $0 | $71,000 |
| 2018 | $1,206 | $66,500 | $0 | $66,500 |
| 2017 | $1,218 | $66,500 | $0 | $66,500 |
| 2016 | $879 | $50,600 | $0 | $50,600 |
| 2015 | $950 | $53,800 | $0 | $53,800 |
| 2014 | $921 | $53,800 | $0 | $53,800 |
Source: Public Records
Map
Nearby Homes
- 176 Maple Ave Unit 7-21
- 176 Maple Ave Unit 3-2
- 176 Maple Ave Unit 4-6
- 176 Maple Ave Unit 1-24
- 176 Maple Ave Unit 2-35
- 176 Maple Ave Unit 1-38
- 176 Maple Ave Unit 6-26
- 189 Maple Ave
- 85 Maple Ave Unit A
- 15 Fidelity Dr Unit 70
- 210 Fidelity Dr Unit 84
- 212 Fidelity Dr Unit 83
- 10 Fidelity Dr Unit 5
- 12 Fidelity Dr Unit 6
- 18 Fidelity Dr Unit 9
- 20 Fidelity Dr Unit 10
- 27 Lewis St
- 6 Lewis St
- 12 Lewis St
- 236 Turkey Hill Rd
- 176 Maple Ave Unit 7-38
- 176 Maple Ave Unit 7-37
- 176 Maple Ave Unit 7-36
- 176 Maple Ave Unit 7-35
- 176 Maple Ave Unit 7-34
- 176 Maple Ave Unit 7-33
- 176 Maple Ave Unit 7-32
- 176 Maple Ave Unit 7-31
- 176 Maple Ave Unit 7-28
- 176 Maple Ave Unit 7-27
- 176 Maple Ave Unit 7-26
- 176 Maple Ave Unit 7-25
- 176 Maple Ave Unit 7-24
- 176 Maple Ave Unit 7-23
- 176 Maple Ave Unit 7-22
- 176 Maple Ave Unit 7-21
- 176 Maple Ave Unit 7-8
- 176 Maple Ave Unit 7-7
- 176 Maple Ave Unit 7-6
- 176 Maple Ave Unit 7-5
Your Personal Tour Guide
Ask me questions while you tour the home.