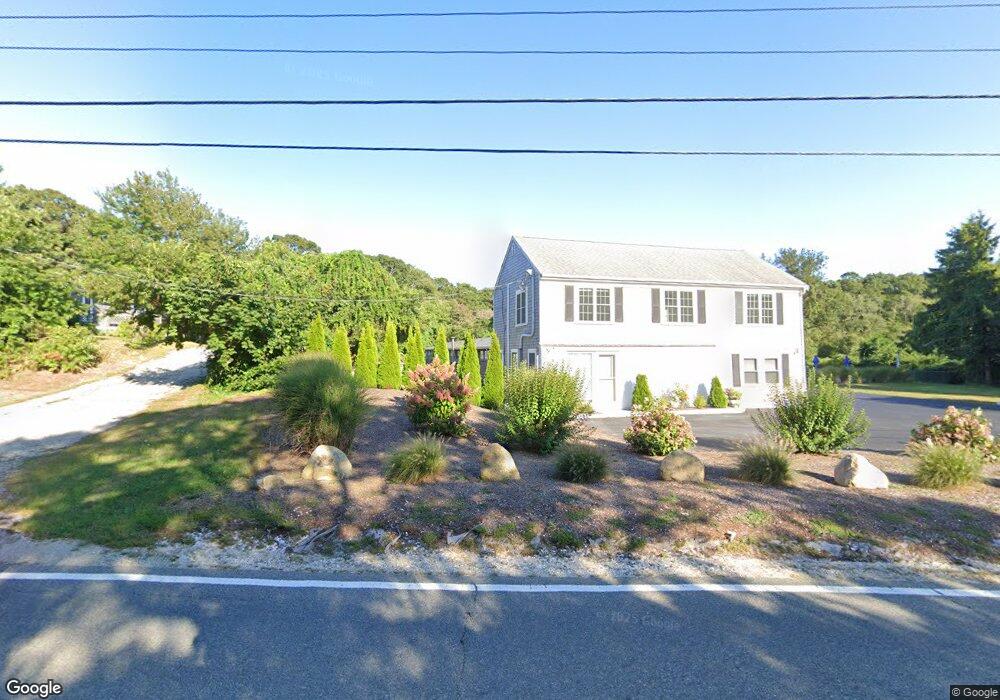
177 Main St Dennis, MA 2638
Dennis Village NeighborhoodEstimated Value: $1,594,748
Studio
--
Bath
4,608
Sq Ft
$346/Sq Ft
Est. Value
About This Home
This home is located at 177 Main St, Dennis, MA 2638 and is currently estimated at $1,594,748, approximately $346 per square foot. 177 Main St is a home located in Barnstable County with nearby schools including Dennis-Yarmouth Regional High School.
Ownership History
Date
Name
Owned For
Owner Type
Purchase Details
Closed on
Jan 24, 2001
Sold by
Anderson Jan
Bought by
Fisher Rt and Fisher Leonard H
Current Estimated Value
Home Financials for this Owner
Home Financials are based on the most recent Mortgage that was taken out on this home.
Original Mortgage
$200,000
Interest Rate
7.39%
Mortgage Type
Commercial
Purchase Details
Closed on
Jul 27, 1989
Sold by
Kelley Suzanne
Bought by
Fisher Leonard H
Create a Home Valuation Report for This Property
The Home Valuation Report is an in-depth analysis detailing your home's value as well as a comparison with similar homes in the area
Home Values in the Area
Average Home Value in this Area
Purchase History
| Date | Buyer | Sale Price | Title Company |
|---|---|---|---|
| Fisher Rt | $451,000 | -- | |
| Fisher Leonard H | $165,000 | -- |
Source: Public Records
Mortgage History
| Date | Status | Borrower | Loan Amount |
|---|---|---|---|
| Open | Fisher Leonard H | $375,000 | |
| Closed | Fisher Leonard H | $200,000 | |
| Previous Owner | Fisher Leonard H | $2,741,108 | |
| Previous Owner | Fisher Leonard H | $206,500 |
Source: Public Records
Tax History
| Year | Tax Paid | Tax Assessment Tax Assessment Total Assessment is a certain percentage of the fair market value that is determined by local assessors to be the total taxable value of land and additions on the property. | Land | Improvement |
|---|---|---|---|---|
| 2025 | $4,335 | $1,001,200 | $396,000 | $605,200 |
| 2024 | $4,278 | $974,600 | $381,600 | $593,000 |
| 2023 | $4,332 | $927,600 | $363,500 | $564,100 |
| 2022 | $4,895 | $874,100 | $342,900 | $531,200 |
| 2021 | $5,096 | $845,100 | $336,200 | $508,900 |
| 2020 | $5,039 | $826,100 | $329,500 | $496,600 |
| 2019 | $5,105 | $827,400 | $329,500 | $497,900 |
| 2018 | $5,262 | $830,000 | $329,500 | $500,500 |
| 2017 | $5,105 | $830,000 | $329,500 | $500,500 |
| 2016 | $5,469 | $837,500 | $329,500 | $508,000 |
| 2015 | $5,360 | $837,500 | $329,500 | $508,000 |
| 2014 | $4,945 | $778,700 | $329,500 | $449,200 |
Source: Public Records
Map
Nearby Homes
- 268 Main St
- 59 Main St Unit 7-3
- 59 Main St Unit 19-2
- 59 Route 6a Unit 9-2
- 59 Route 6a Unit 7-3
- 568 Route 6a
- 26 S West Dr
- 59 Massachusetts 6a Unit 19-2
- 39 Whittier Dr
- 20 Bray Farm Rd S
- 14 S Yarmouth Rd
- 480 Main St
- 6 Thomas Ct
- 15 Signal Hill Dr
- 35 Crown Grant Dr
- 54 Kates Path Unit 54
- 15 John Hall Cartway Unit 15
- 15 Musket Ln
- 15 Jonquil Rd
- 645 Main St Back Lot
Your Personal Tour Guide
Ask me questions while you tour the home.