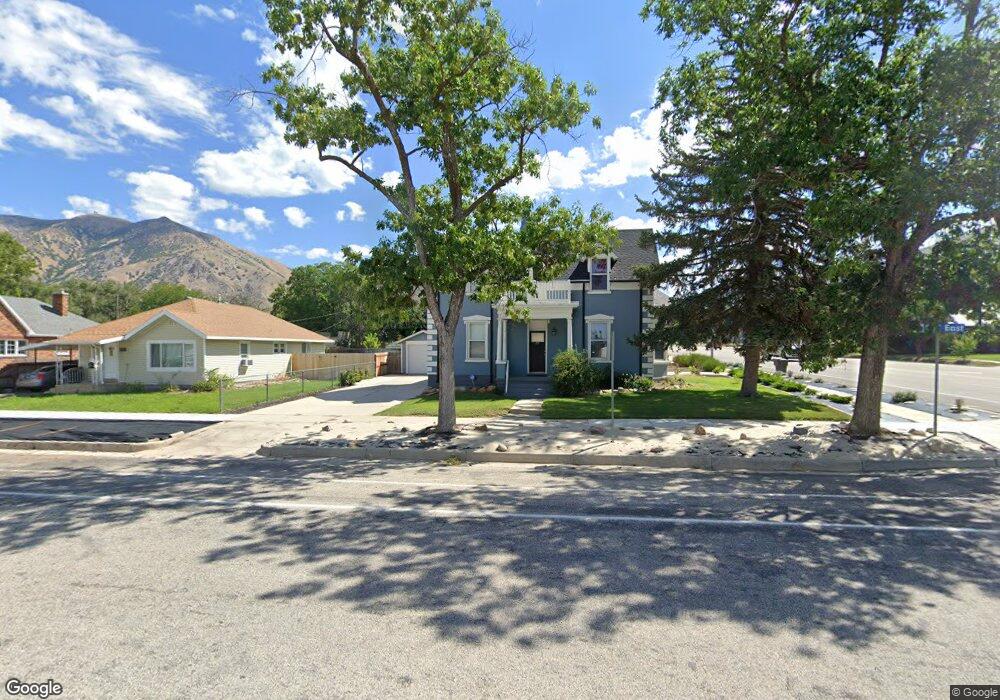
177 S 200 E Brigham City, UT 84302
Estimated Value: $384,000 - $438,000
4
Beds
2
Baths
2,795
Sq Ft
$146/Sq Ft
Est. Value
About This Home
This home is located at 177 S 200 E, Brigham City, UT 84302 and is currently estimated at $406,882, approximately $145 per square foot. 177 S 200 E is a home located in Box Elder County with nearby schools including Golden Spike Elementary, Box Elder Middle School, and Adele C. Young Intermediate School.
Ownership History
Date
Name
Owned For
Owner Type
Purchase Details
Closed on
Mar 29, 2019
Sold by
Spraky 2 Investments Llc
Bought by
Ciampini Linda
Current Estimated Value
Purchase Details
Closed on
Aug 22, 2018
Sold by
Talbot Scott J and Talbot Mary K
Bought by
Jpmorgan Chase Bank National Association
Purchase Details
Closed on
Aug 17, 2018
Sold by
Talbot Scott J and Talbot Mary K
Bought by
Sparky 2 Investments Llc
Create a Home Valuation Report for This Property
The Home Valuation Report is an in-depth analysis detailing your home's value as well as a comparison with similar homes in the area
Purchase History
| Date | Buyer | Sale Price | Title Company |
|---|---|---|---|
| Ciampini Linda | -- | Mountain View Title Ogden | |
| Jpmorgan Chase Bank National Association | $112,000 | Etitle Insurance Agency | |
| Sparky 2 Investments Llc | -- | Capstone Title And Escrow In |
Source: Public Records
Tax History
| Year | Tax Paid | Tax Assessment Tax Assessment Total Assessment is a certain percentage of the fair market value that is determined by local assessors to be the total taxable value of land and additions on the property. | Land | Improvement |
|---|---|---|---|---|
| 2025 | $345 | $356,401 | $105,000 | $251,401 |
| 2024 | $218 | $351,752 | $100,000 | $251,752 |
| 2023 | $1,899 | $374,327 | $95,000 | $279,327 |
| 2022 | $238 | $177,282 | $22,000 | $155,282 |
| 2021 | $1,920 | $257,298 | $40,000 | $217,298 |
| 2020 | $1,584 | $257,298 | $40,000 | $217,298 |
| 2019 | $1,087 | $93,936 | $22,000 | $71,936 |
| 2018 | $984 | $84,553 | $22,000 | $62,553 |
| 2017 | $835 | $124,283 | $16,500 | $94,283 |
| 2016 | $875 | $65,886 | $16,500 | $49,386 |
| 2015 | $818 | $61,397 | $16,500 | $44,897 |
| 2014 | $818 | $59,259 | $16,500 | $42,759 |
| 2013 | -- | $59,259 | $16,500 | $42,759 |
Source: Public Records
Map
Nearby Homes
Your Personal Tour Guide
Ask me questions while you tour the home.