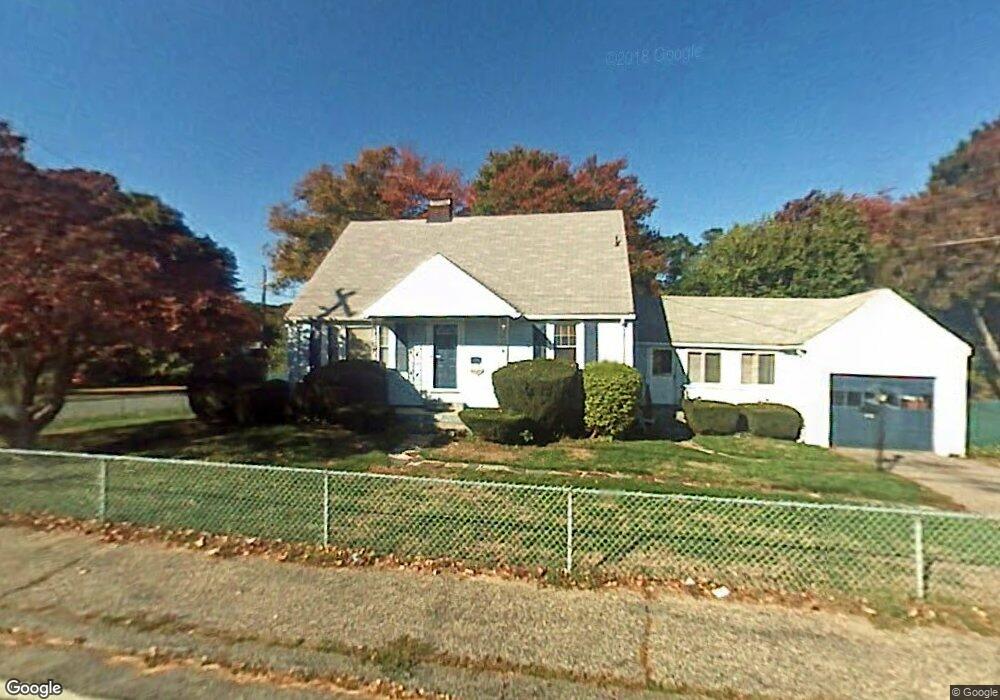
179 Chestnut St Randolph, MA 02368
North Randolph NeighborhoodEstimated Value: $438,000 - $509,000
3
Beds
1
Bath
1,152
Sq Ft
$423/Sq Ft
Est. Value
About This Home
This home is located at 179 Chestnut St, Randolph, MA 02368 and is currently estimated at $487,565, approximately $423 per square foot. 179 Chestnut St is a home located in Norfolk County with nearby schools including Randolph High School and Lighthouse Baptist Christian Academy.
Ownership History
Date
Name
Owned For
Owner Type
Purchase Details
Closed on
Jan 6, 1998
Sold by
Walsh Exr Francis R and Walsh Exr Joseph M
Bought by
Niles Susan M
Current Estimated Value
Create a Home Valuation Report for This Property
The Home Valuation Report is an in-depth analysis detailing your home's value as well as a comparison with similar homes in the area
Home Values in the Area
Average Home Value in this Area
Purchase History
| Date | Buyer | Sale Price | Title Company |
|---|---|---|---|
| Niles Susan M | $123,500 | -- |
Source: Public Records
Mortgage History
| Date | Status | Borrower | Loan Amount |
|---|---|---|---|
| Open | Niles Susan M | $25,000 | |
| Open | Niles Susan M | $167,800 |
Source: Public Records
Tax History
| Year | Tax Paid | Tax Assessment Tax Assessment Total Assessment is a certain percentage of the fair market value that is determined by local assessors to be the total taxable value of land and additions on the property. | Land | Improvement |
|---|---|---|---|---|
| 2025 | $5,475 | $471,600 | $252,100 | $219,500 |
| 2024 | $5,297 | $462,600 | $247,200 | $215,400 |
| 2023 | $5,094 | $421,700 | $224,600 | $197,100 |
| 2022 | $5,071 | $372,900 | $187,100 | $185,800 |
| 2021 | $4,730 | $320,000 | $156,000 | $164,000 |
| 2020 | $4,634 | $310,800 | $156,000 | $154,800 |
| 2019 | $4,506 | $300,800 | $148,600 | $152,200 |
| 2018 | $4,305 | $271,100 | $135,100 | $136,000 |
| 2017 | $4,207 | $260,000 | $128,600 | $131,400 |
| 2016 | $4,048 | $232,800 | $116,900 | $115,900 |
| 2015 | $3,870 | $213,800 | $111,300 | $102,500 |
Source: Public Records
Map
Nearby Homes
- 37 Himoor Cir
- 19 Smith Rd
- 11 Old Farm Rd
- 10 Simmonds Blvd Unit 10
- 1004 N Main St
- 1 Royal Crest Dr Unit 3
- 5 Dartmouth St
- 232 Canton St Unit 308
- 232 Canton St Unit 112
- 232 Canton St Unit 104
- 22 Clark St
- 12 Jasper Ln Unit 12
- 20 Jasper Ln
- 35 Pearl St Unit 35
- 45 Saddleback Ln
- 159 Bittersweet Ln Unit 107
- 13 Mcauliffe Rd
- 469 North St
- 85 Russ St
- 33 Hemlock Terrace
Your Personal Tour Guide
Ask me questions while you tour the home.