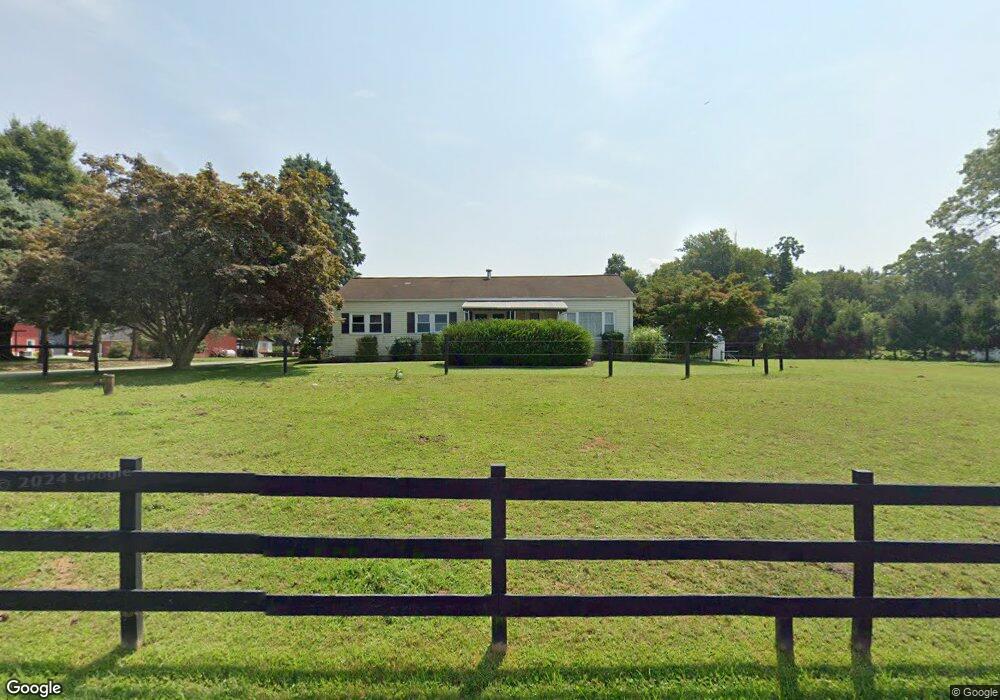
179 Peach Bottom Rd Peach Bottom, PA 17563
Fulton NeighborhoodEstimated Value: $238,000 - $390,000
3
Beds
1
Bath
2,298
Sq Ft
$132/Sq Ft
Est. Value
About This Home
This home is located at 179 Peach Bottom Rd, Peach Bottom, PA 17563 and is currently estimated at $302,333, approximately $131 per square foot. 179 Peach Bottom Rd is a home located in Lancaster County with nearby schools including Smith Middle School and Solanco High School.
Ownership History
Date
Name
Owned For
Owner Type
Purchase Details
Closed on
May 4, 2020
Sold by
Church Micahel M and Church Sharon H
Bought by
Esh Jonas S and Esh Barbie E
Current Estimated Value
Purchase Details
Closed on
Mar 20, 2009
Sold by
Way John
Bought by
Church Michael M and Roth Sharon H
Purchase Details
Closed on
Jul 4, 2001
Sold by
Roth Jeffrey I and Roth Joanne B
Bought by
Way John
Create a Home Valuation Report for This Property
The Home Valuation Report is an in-depth analysis detailing your home's value as well as a comparison with similar homes in the area
Home Values in the Area
Average Home Value in this Area
Purchase History
| Date | Buyer | Sale Price | Title Company |
|---|---|---|---|
| Esh Jonas S | $150,000 | None Available | |
| Church Michael M | $185,000 | First American Abstract Of P | |
| Way John | $105,000 | -- |
Source: Public Records
Tax History
| Year | Tax Paid | Tax Assessment Tax Assessment Total Assessment is a certain percentage of the fair market value that is determined by local assessors to be the total taxable value of land and additions on the property. | Land | Improvement |
|---|---|---|---|---|
| 2025 | $2,181 | $139,800 | $81,800 | $58,000 |
| 2024 | $2,181 | $139,800 | $81,800 | $58,000 |
| 2023 | $2,115 | $139,800 | $81,800 | $58,000 |
| 2022 | $2,022 | $139,800 | $81,800 | $58,000 |
| 2021 | $1,898 | $139,800 | $81,800 | $58,000 |
| 2020 | $1,898 | $139,800 | $81,800 | $58,000 |
| 2019 | $1,898 | $139,800 | $81,800 | $58,000 |
| 2018 | $430 | $139,800 | $81,800 | $58,000 |
| 2017 | $1,328 | $81,000 | $43,100 | $37,900 |
| 2016 | $1,328 | $81,000 | $43,100 | $37,900 |
| 2015 | $320 | $81,000 | $43,100 | $37,900 |
| 2014 | $956 | $81,000 | $43,100 | $37,900 |
Source: Public Records
Map
Nearby Homes
- 140 Arcadia Trace
- 312 Arcadia Trace
- 1534 Benton Hollow Rd
- 511 Edgewood Ln
- 340 Peach Bottom Rd
- 847 Goshen Mill Rd
- 1019 Spring Valley Rd
- 19 Jubilee Park
- 1912 Rivervue
- 225 Black Rd
- 743 Bell Manor Rd
- 94 Green Ln
- 397 Jackson Rd
- 520 Bell Manor Rd
- 0 New Bridge Rd Unit MDCC2014434
- 18 Booker Rd
- 204 Canterbury Ct
- 36 Hazlette Ct
- Lot 16 Londonderry Ln
- 668 Scotland Rd
- 187 Peach Bottom Rd
- 177 Peach Bottom Rd
- 191 Peach Bottom Rd
- 193 Peach Bottom Rd
- 195 Peach Bottom Rd Unit 1
- 143 Peach Bottom Rd
- 157 Westbrook Rd
- 215 Peach Bottom Rd
- 116 Westbrook Rd
- 159 Westbrook Rd
- 108 Westbrook Rd
- 138 Peach Bottom Rd
- 166 Westbrook Rd
- 190 Arcadia Trace
- 168 Westbrook Rd
- 132 Peach Bottom Rd
- 159 Arcadia Trace
- 166 Arcadia Trace
- 196 Arcadia Trace
- 196 Arcadia Trace
Your Personal Tour Guide
Ask me questions while you tour the home.