179 Sisson St Providence, RI 02909
Manton NeighborhoodEstimated Value: $405,814 - $511,000
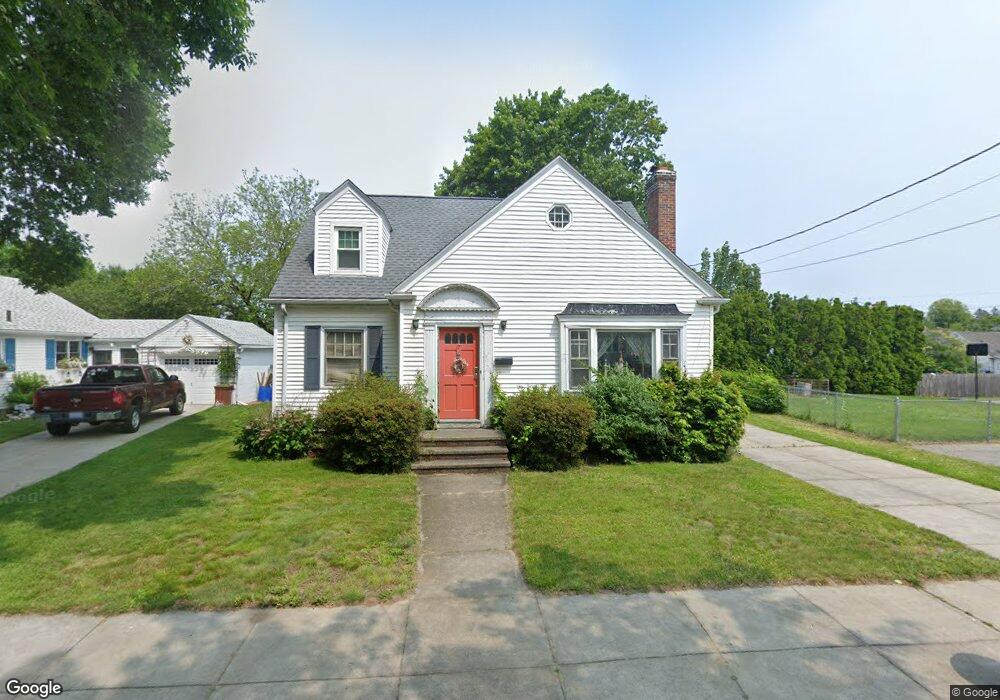
About This Home
This home is located at 179 Sisson St, Providence, RI 02909 and is currently estimated at $446,704, approximately $283 per square foot. 179 Sisson St is a home located in Providence County with nearby schools including Asa Messer Elementary School, Harry Kizirian Elementary School, and Veazie Street Elementary School.
Ownership History
We collect this data history from publicly available records. To have your information removed, we recommend requesting removal directly through your county’s website.
Purchase Details
Home Values in the Area
Average Home Value in this Area
Purchase History
We collect this data history from publicly available records. To have your information removed, we recommend requesting removal directly through your county’s website.
| Date | Buyer | Sale Price | Title Company |
|---|---|---|---|
| $100,500 | -- |
Mortgage History
We collect this data history from publicly available records. To have your information removed, we recommend requesting removal directly through your county’s website.
| Date | Status | Borrower | Loan Amount |
|---|---|---|---|
| Open | $30,000 |
Tax History
We collect this data history from publicly available records. To have your information removed, we recommend requesting removal directly through your county’s website.
| Year | Tax Paid | Tax Assessment Tax Assessment Total Assessment is a certain percentage of the fair market value that is determined by local assessors to be the total taxable value of land and additions on the property. | Land | Improvement |
|---|---|---|---|---|
| 2025 | $3,009 | $358,200 | $131,300 | $226,900 |
| 2024 | $4,852 | $264,400 | $75,900 | $188,500 |
| 2023 | $4,852 | $264,400 | $75,900 | $188,500 |
| 2022 | $4,706 | $264,400 | $75,900 | $188,500 |
| 2021 | $4,883 | $198,800 | $56,300 | $142,500 |
| 2020 | $4,883 | $198,800 | $56,300 | $142,500 |
| 2019 | $4,883 | $198,800 | $56,300 | $142,500 |
| 2018 | $4,628 | $144,800 | $36,100 | $108,700 |
| 2017 | $4,628 | $144,800 | $36,100 | $108,700 |
| 2016 | $4,628 | $144,800 | $36,100 | $108,700 |
| 2015 | $4,210 | $127,200 | $33,100 | $94,100 |
| 2014 | $4,293 | $127,200 | $33,100 | $94,100 |
| 2013 | $4,293 | $127,200 | $33,100 | $94,100 |
Map
- 200 Unit St
- 171 Unit St
- 21 Imera St
- 25 Lucy St
- 86 Lynch St
- 54 Ada St
- 1279 Chalkstone Ave
- 15 Gage St
- 44 Winthrop Ave
- 41 Harmony Dr
- 37 Harmony Dr
- 37 Harmony Dr
- 35 Sisson St
- 254 Mount Pleasant Ave
- 61 Leah St
- 116 Mount Pleasant Ave Unit 118
- 147 Pomona Ave
- 35 Gray St
- 11 Brinkley St
- 110 Mount Pleasant Ave
Ask me questions while you tour the home.