18 Argyle Cir Seymour, CT 06483
Seymour AreaEstimated Value: $350,000 - $454,000
About This Home
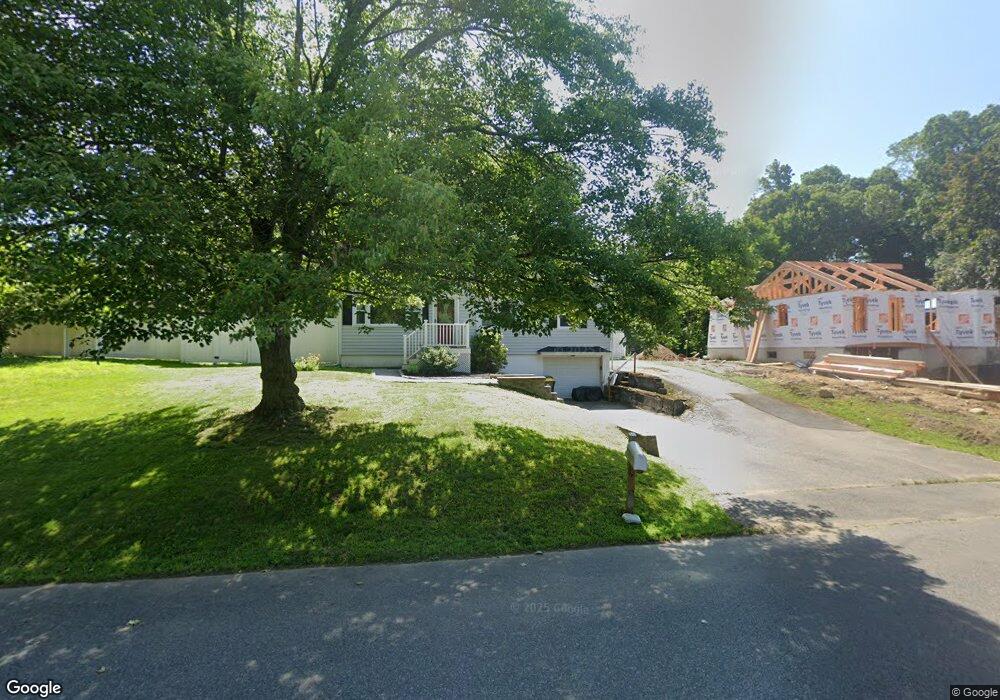
This home is located at 18 Argyle Cir, Seymour, CT 06483 and is currently estimated at $396,530, approximately $284 per square foot. 18 Argyle Cir is a home located in New Haven County with nearby schools including Seymour Middle School and Seymour High School.
Ownership History
We collect this data history from publicly available records. To have your information removed, we recommend requesting removal directly through your county’s website.
Purchase Details
Purchase Details
Home Values in the Area
Average Home Value in this Area
Purchase History
We collect this data history from publicly available records. To have your information removed, we recommend requesting removal directly through your county’s website.
| Date | Buyer | Sale Price | Title Company |
|---|---|---|---|
| -- | -- | ||
| $235,000 | -- |
Mortgage History
We collect this data history from publicly available records. To have your information removed, we recommend requesting removal directly through your county’s website.
| Date | Status | Borrower | Loan Amount |
|---|---|---|---|
| Previous Owner | $213,637 |
Tax History
We collect this data history from publicly available records. To have your information removed, we recommend requesting removal directly through your county’s website.
| Year | Tax Paid | Tax Assessment Tax Assessment Total Assessment is a certain percentage of the fair market value that is determined by local assessors to be the total taxable value of land and additions on the property. | Land | Improvement |
|---|---|---|---|---|
| 2025 | $5,445 | $196,420 | $46,480 | $149,940 |
| 2024 | $4,941 | $134,120 | $38,640 | $95,480 |
| 2023 | $4,826 | $134,120 | $38,640 | $95,480 |
| 2022 | $4,773 | $134,120 | $38,640 | $95,480 |
| 2021 | $4,655 | $134,120 | $38,640 | $95,480 |
| 2020 | $4,571 | $126,980 | $45,360 | $81,620 |
| 2019 | $4,571 | $126,980 | $45,360 | $81,620 |
| 2018 | $4,571 | $126,980 | $45,360 | $81,620 |
| 2017 | $4,571 | $126,980 | $45,360 | $81,620 |
| 2016 | $4,571 | $126,980 | $45,360 | $81,620 |
| 2015 | $4,639 | $134,120 | $47,740 | $86,380 |
| 2014 | $4,565 | $134,120 | $47,740 | $86,380 |
Map
- 6 Anne Ave
- 11 Lilac Dr Unit B
- 30 Bunting Rd
- 168 Miller Rd
- 15 Briarwood Dr
- 29 Evening Star Dr
- 29 Evergreen Terrace
- 225 Bethmour Rd
- 31 Smith St
- 37 Anella Dr
- 211 Meadow St
- 32 Hallsey Ln
- 6 Susan St
- 10 Donna St
- 11 Summer Brook Way Unit 11
- 186 Schaeffer Rd
- 259 Peck Hill Rd
- 108 Humphrey St
- 98 Washington Ave
- 150 Pearl St
Ask me questions while you tour the home.