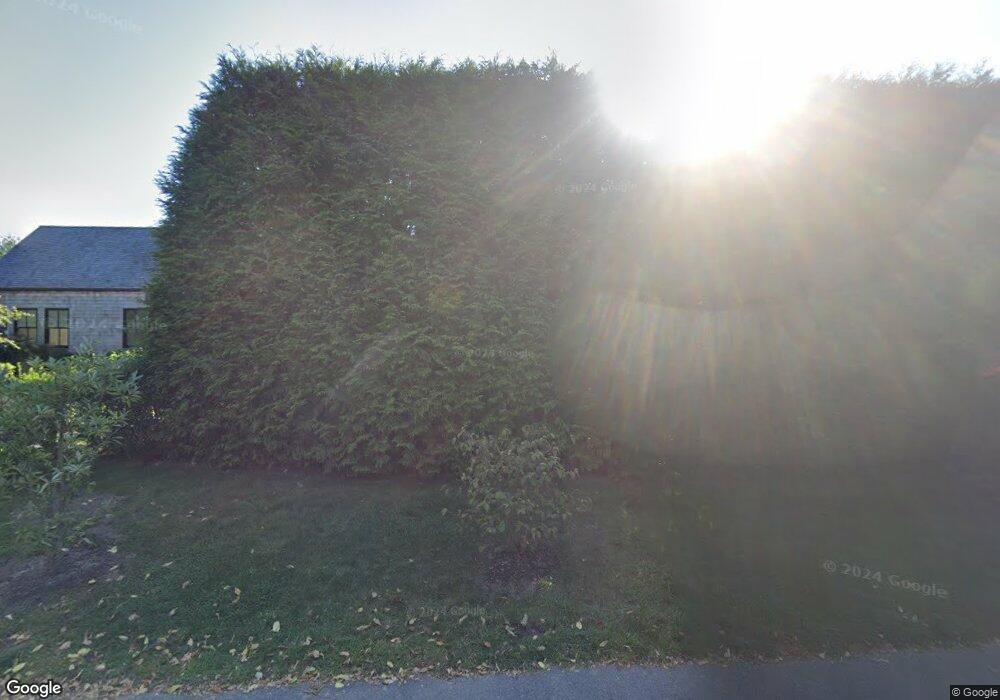
18 Bayview Rd Sag Harbor, NY 11963
Estimated Value: $2,626,000 - $5,294,000
4
Beds
1
Bath
2,051
Sq Ft
$1,746/Sq Ft
Est. Value
About This Home
This home is located at 18 Bayview Rd, Sag Harbor, NY 11963 and is currently estimated at $3,580,668, approximately $1,745 per square foot. 18 Bayview Rd is a home located in Suffolk County with nearby schools including Sag Harbor Elementary School, Pierson Middle/High School, and Ross Lower School.
Ownership History
Date
Name
Owned For
Owner Type
Purchase Details
Closed on
Jul 13, 2011
Sold by
Cavaco Cayli
Bought by
Reck Cayli Cavaco and Reck John Michael
Current Estimated Value
Home Financials for this Owner
Home Financials are based on the most recent Mortgage that was taken out on this home.
Original Mortgage
$431,200
Outstanding Balance
$299,991
Interest Rate
4.75%
Mortgage Type
Purchase Money Mortgage
Estimated Equity
$3,280,677
Purchase Details
Closed on
Dec 11, 1998
Sold by
Grauer Rhoda
Bought by
Cavaco Cayli
Create a Home Valuation Report for This Property
The Home Valuation Report is an in-depth analysis detailing your home's value as well as a comparison with similar homes in the area
Home Values in the Area
Average Home Value in this Area
Purchase History
| Date | Buyer | Sale Price | Title Company |
|---|---|---|---|
| Reck Cayli Cavaco | -- | -- | |
| Cavaco Cayli | $295,000 | Chicago Title |
Source: Public Records
Mortgage History
| Date | Status | Borrower | Loan Amount |
|---|---|---|---|
| Open | Reck Cayli Cavaco | $431,200 |
Source: Public Records
Tax History
| Year | Tax Paid | Tax Assessment Tax Assessment Total Assessment is a certain percentage of the fair market value that is determined by local assessors to be the total taxable value of land and additions on the property. | Land | Improvement |
|---|---|---|---|---|
| 2024 | -- | $1,700,000 | $523,000 | $1,177,000 |
| 2023 | -- | $1,700,000 | $523,000 | $1,177,000 |
| 2022 | $4,595 | $1,028,500 | $523,000 | $505,500 |
| 2021 | $4,595 | $623,200 | $475,400 | $147,800 |
| 2020 | $4,133 | $623,200 | $475,400 | $147,800 |
| 2019 | $4,133 | $0 | $0 | $0 |
| 2018 | -- | $611,000 | $475,400 | $135,600 |
| 2017 | $4,344 | $611,000 | $475,400 | $135,600 |
| 2016 | $4,484 | $611,000 | $475,400 | $135,600 |
| 2015 | -- | $611,000 | $475,400 | $135,600 |
| 2014 | -- | $611,000 | $475,400 | $135,600 |
Source: Public Records
Map
Nearby Homes
- 7 Sims Ave
- 22 Peninsula Dr
- 210 Redwood Rd
- 221 Redwood Rd
- 45 Harbor Watch Ct
- 10 Bluff Point Ln
- 254 Harbor Watch Ct
- 4529 Noyac Rd
- 4528 Noyac Rd
- 961 Brick Kiln Rd
- 41 Cove Dr
- 59 Highview Dr
- 35 Sunset Dr
- 20 Whalers Walk
- 16 Redwood Rd
- 1350 Brick Kiln Rd
- 1363 Brick Kiln Rd
- 338 Main St
- 352 Main St
- 120 Glover St
Your Personal Tour Guide
Ask me questions while you tour the home.