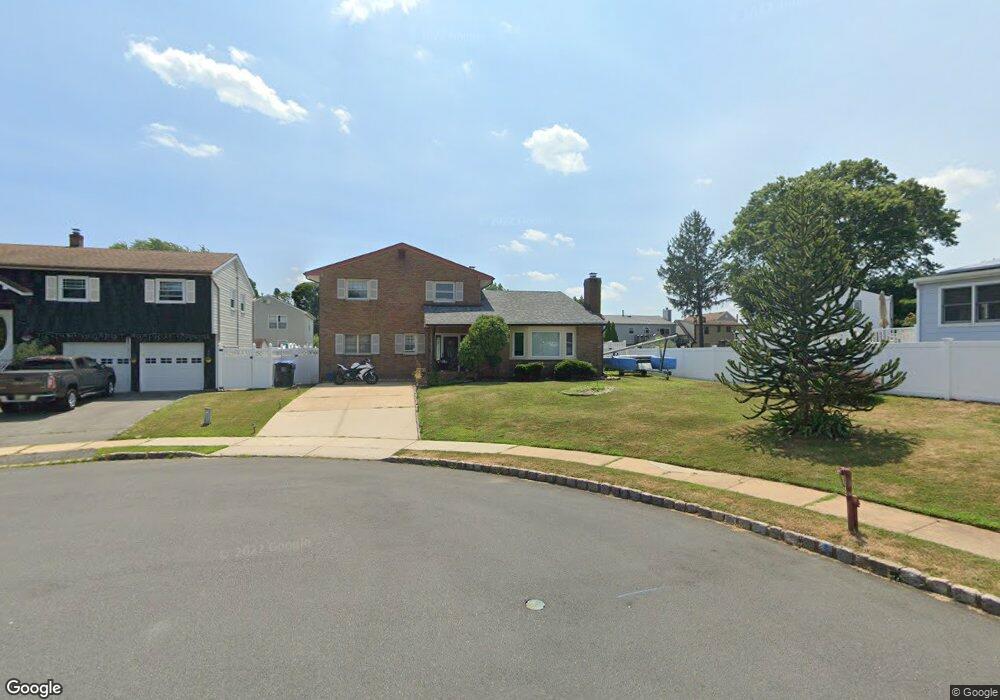
18 Bobby Ct Sewaren, NJ 07077
Estimated Value: $453,836 - $571,000
3
Beds
2
Baths
1,894
Sq Ft
$283/Sq Ft
Est. Value
About This Home
This home is located at 18 Bobby Ct, Sewaren, NJ 07077 and is currently estimated at $536,709, approximately $283 per square foot. 18 Bobby Ct is a home located in Middlesex County with nearby schools including Matthew Jago Elementary School, Avenel Middle School, and Woodbridge High School.
Ownership History
Date
Name
Owned For
Owner Type
Purchase Details
Closed on
Mar 26, 2020
Sold by
Caracaus Melinda and Caracaus Bruce A
Bought by
Pasaniello Elizabeth
Current Estimated Value
Home Financials for this Owner
Home Financials are based on the most recent Mortgage that was taken out on this home.
Original Mortgage
$252,000
Outstanding Balance
$223,241
Interest Rate
3.4%
Mortgage Type
New Conventional
Estimated Equity
$313,468
Purchase Details
Closed on
Jun 3, 1990
Bought by
Caracaus Melinda
Create a Home Valuation Report for This Property
The Home Valuation Report is an in-depth analysis detailing your home's value as well as a comparison with similar homes in the area
Home Values in the Area
Average Home Value in this Area
Purchase History
| Date | Buyer | Sale Price | Title Company |
|---|---|---|---|
| Pasaniello Elizabeth | $315,000 | Fortune Title Agency Inc | |
| Caracaus Melinda | -- | -- |
Source: Public Records
Mortgage History
| Date | Status | Borrower | Loan Amount |
|---|---|---|---|
| Open | Pasaniello Elizabeth | $252,000 |
Source: Public Records
Tax History
| Year | Tax Paid | Tax Assessment Tax Assessment Total Assessment is a certain percentage of the fair market value that is determined by local assessors to be the total taxable value of land and additions on the property. | Land | Improvement |
|---|---|---|---|---|
| 2025 | $11,545 | $85,300 | $18,000 | $67,300 |
| 2024 | $11,260 | $85,300 | $18,000 | $67,300 |
| 2023 | $11,260 | $85,300 | $18,000 | $67,300 |
| 2022 | $10,574 | $85,300 | $18,000 | $67,300 |
| 2021 | $10,465 | $85,300 | $18,000 | $67,300 |
| 2020 | $11,544 | $97,300 | $18,000 | $79,300 |
| 2019 | $11,251 | $97,300 | $18,000 | $79,300 |
| 2018 | $10,955 | $97,300 | $18,000 | $79,300 |
| 2017 | $10,734 | $97,300 | $18,000 | $79,300 |
| 2016 | $10,632 | $97,300 | $18,000 | $79,300 |
| 2015 | $10,423 | $97,300 | $18,000 | $79,300 |
| 2014 | $10,039 | $96,000 | $18,000 | $78,000 |
Source: Public Records
Map
Nearby Homes
Your Personal Tour Guide
Ask me questions while you tour the home.