18 Brady St Warren, RI 02885
Child Street West NeighborhoodEstimated Value: $496,000 - $797,000
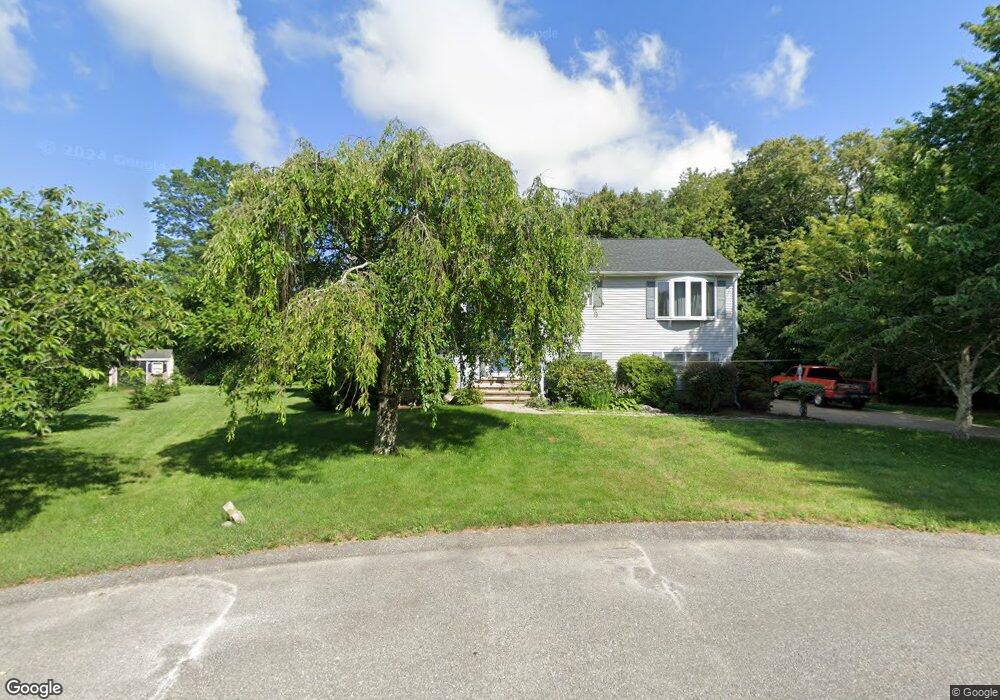
About This Home
This home is located at 18 Brady St, Warren, RI 02885 and is currently estimated at $639,870, approximately $264 per square foot. 18 Brady St is a home located in Bristol County with nearby schools including Mt. Hope High School, Highlander Charter Middle and High School, and East Bay Career Academy.
Ownership History
We collect this data history from publicly available records. To have your information removed, we recommend requesting removal directly through your county’s website.
Purchase Details
Home Values in the Area
Average Home Value in this Area
Purchase History
We collect this data history from publicly available records. To have your information removed, we recommend requesting removal directly through your county’s website.
| Date | Buyer | Sale Price | Title Company |
|---|---|---|---|
| $175,000 | -- |
Mortgage History
We collect this data history from publicly available records. To have your information removed, we recommend requesting removal directly through your county’s website.
| Date | Status | Borrower | Loan Amount |
|---|---|---|---|
| Open | $30,000 | ||
| Open | $120,000 |
Tax History
We collect this data history from publicly available records. To have your information removed, we recommend requesting removal directly through your county’s website.
| Year | Tax Paid | Tax Assessment Tax Assessment Total Assessment is a certain percentage of the fair market value that is determined by local assessors to be the total taxable value of land and additions on the property. | Land | Improvement |
|---|---|---|---|---|
| 2025 | $7,509 | $504,300 | $163,300 | $341,000 |
| 2024 | $7,282 | $504,300 | $163,300 | $341,000 |
| 2023 | $6,889 | $504,300 | $163,300 | $341,000 |
| 2022 | $6,444 | $357,800 | $141,100 | $216,700 |
| 2021 | $6,478 | $365,600 | $141,100 | $224,500 |
| 2020 | $6,347 | $365,600 | $141,100 | $224,500 |
| 2019 | $6,484 | $339,300 | $126,400 | $212,900 |
| 2018 | $6,399 | $339,300 | $126,400 | $212,900 |
| 2017 | $6,382 | $339,300 | $126,400 | $212,900 |
| 2016 | $5,829 | $291,900 | $88,300 | $203,600 |
| 2015 | $5,829 | $291,900 | $88,300 | $203,600 |
| 2014 | $5,858 | $291,900 | $88,300 | $203,600 |
Map
- 388 Child St
- 367 Child St
- 511 Child St Unit 205
- 510 Child St Unit 401A
- 510 Child St Unit 105B
- 510 Child St Unit 204C
- 510 Child St Unit 201C
- 596 Metacom Ave
- 10 Lincoln Ave
- 18 Almeida Dr
- 5 Lee Dr
- 75 Croade St
- 12 Highview Ave
- 51 Cutler St
- 36 Munro Ave
- 115 Market St
- 41 Overhill Rd
- 22 Kinnicutt Ave
- 73 Child St
- 36 Kinnicutt Ave
Ask me questions while you tour the home.